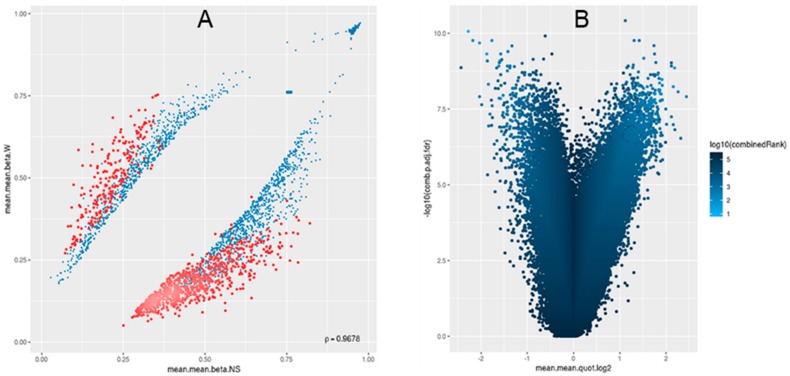
Figure 3.
For the 1000 most differentially methylated tiling regions, scatterplot (A) and (B) volcano plot analyses were performed. In panel A, the mean of mean methylation levels (β) for warts (W) is on the y-axis, while the mean of mean methylation levels (β) for normal skin (NS) is on the x-axis. β values range from unmethylated (0) to methylated (1). In panel B, the volcano plot shows the differential methylation of genomic tiling regions as quantified by log2 of the mean quotient in means across all sites in a region on the x-axis and the adjusted combined p-value on the y-axis between warts (W) and normal skin (NS). The color scale corresponds with the combined rank of each genomic tiling region.

