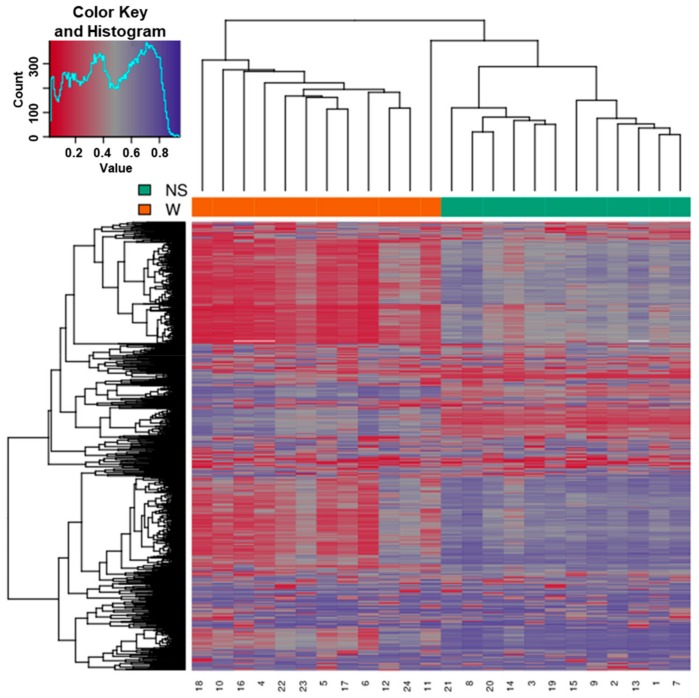
Figure 4.
Heatmap showing the hierarchical clustering of samples displaying only the 1000 most variable loci with the highest variance across all samples. Clustering used complete linkage and Manhattan distance. Patient identification number is shown on the bottom x-axis. The normal skin (NS) and wart (W) samples are shown on the top x-axis. Values of 0 (red color) and 1 (purple color) indicate decreased and increased methylation, respectively.

