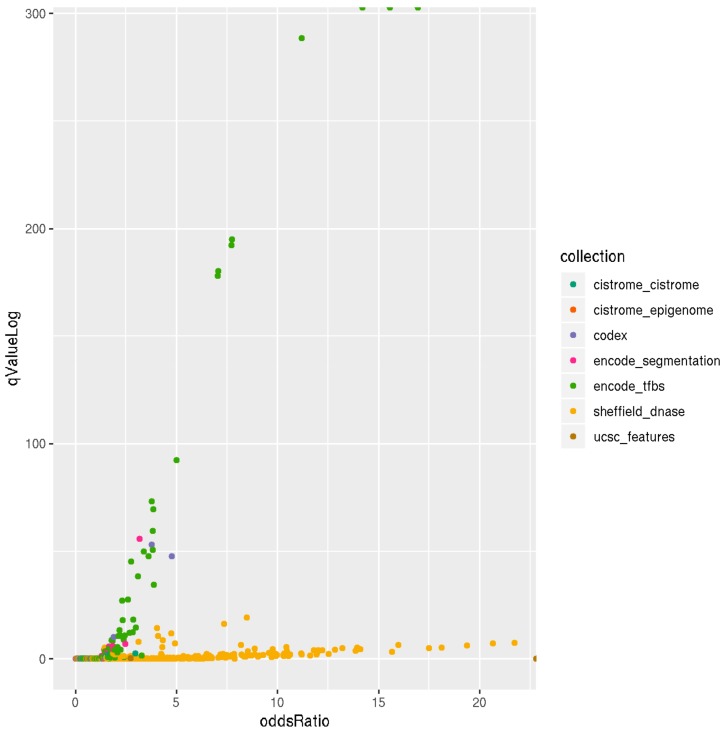
Figure 6.
Scatterplot of LOLA enrichment analysis showing the effect size (log-odds ratio) versus the significant q-value (−log10 (q-value)) of the 1000 most hypermethylated tiling regions. These regions show strong association and significant overlap with Sheffield_dnase and encode_tfbs as indicated by the large odds ratio and higher q-value. LOLA reference databases collections are shown on the right side of the plot with color coding.

