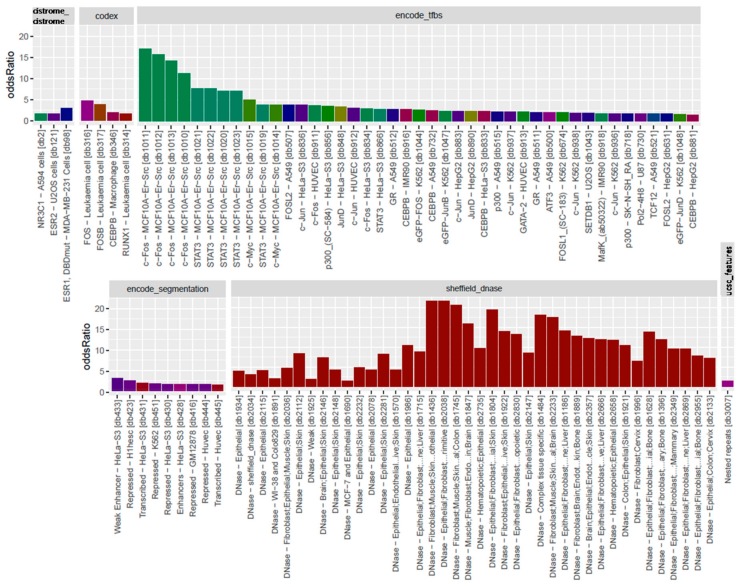
Figure 8.
Bar plots of LOLA enrichment analysis showing the log-odds ratios of the 1000 most hypermethylated tiling regions. Terms that exhibit statistical significance (p-value < 0.01) are shown. For encode_tfbs, c-Fos, STAT3, and c-Myc are among the top enriched terms showing large odds ratio values. Fibroblast cells, epithelial cells, muscle tissue, and skin tissue were among the most enriched cell and tissue types. Coloring of the bars reflects the putative targets of the terms.

