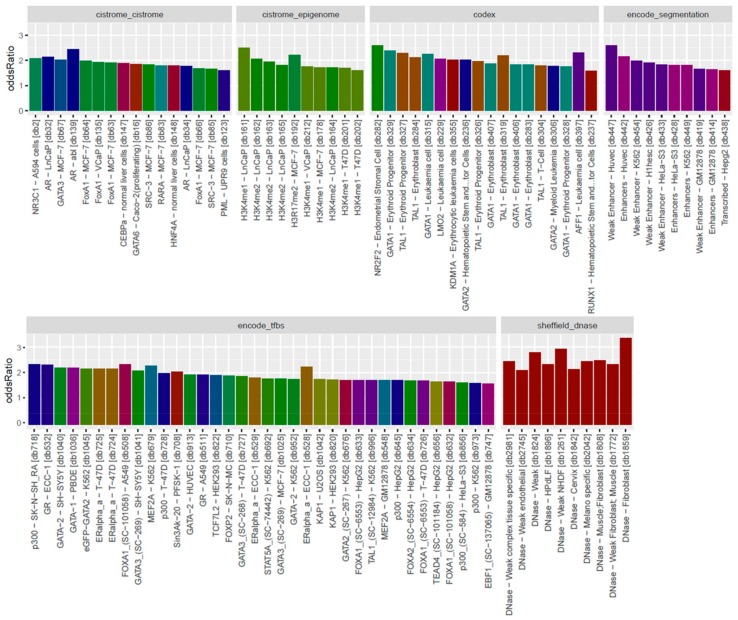
Figure 9.
Bar plots of LOLA enrichment analysis showing log-odds ratios of the 1000 most hypomethylated tiling regions. Terms that exhibit statistical significance (p-value < 0.01) are shown. The most enriched terms include Dnase weak-NHDF, Dnase-fibrobalsts, Weak Enhancer-HUVEC, NR2F2-Endometrial Stromal Cell, AFF1-leukaemia, H3K4me1-LNCaP, and androgen receptor (AR)-abl. Coloring of the bars reflects the putative targets of the terms.

