Figure 6.
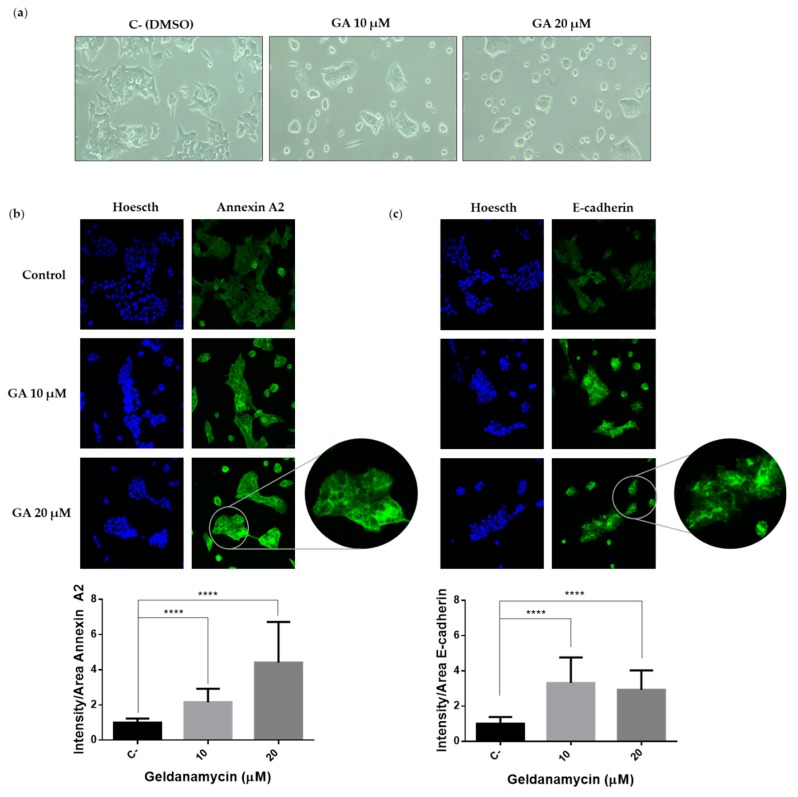
Geldanamycin induces an epithelial-like phenotype accompanied by an increase expression of E-cadherin and Annexin A2: HCT116 cell line was treated at the indicated concentrations of geldanamycin (GA) for 24 h. (a) Images of HCT116 were taken by optical microscopy. (b) Representative immunofluorescence images of Annexin A2 are shown (upper panel) and fluorescence intensity quantification is represented (lower panel). (c) Representative immunofluorescence images of E-cadherin are shown (upper panel) and fluorescence intensity quantification is represented (lower panel). Images were taken with confocal microscope by employing 40× magnification objective. A zoom image of 80X magnification was included. Annexin A2 and E-cadherin were stained in green, and cell nuclei were counterstained with Hoechst. Quantification of intensity/area was represented as Mean ± SEM (**** p < 0.0001).

