Figure 9.
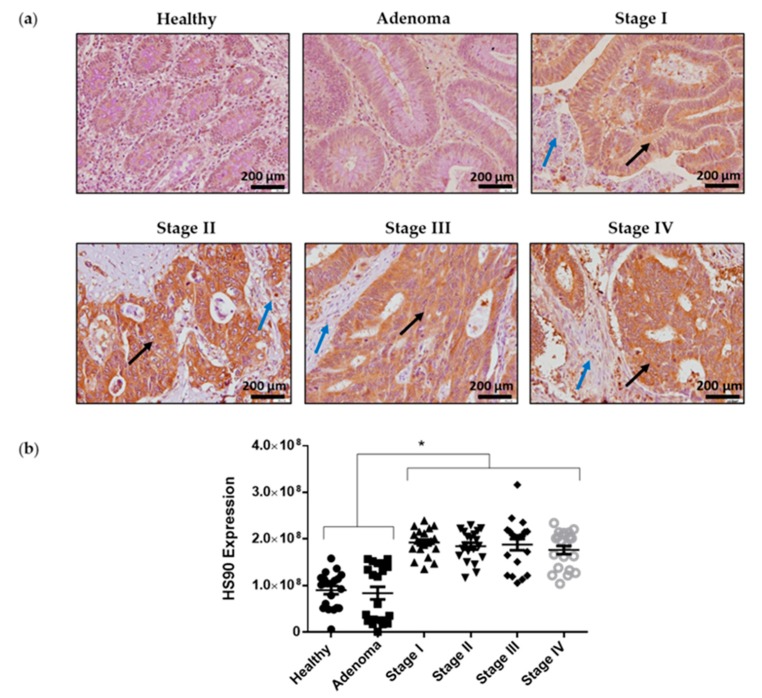
Hsp90 expression levels in colorectal cancer human samples: (a) Representative images of Hsp90 immunoreactivity in normal colonic mucosa, adenoma and colorectal cancer (TNM stages I–IV). Images were obtained with 20× objective. Scale bar 125 µm. (b) Statistical quantification of Hsp90 staining intensity in epithelial cancer cells at different colon cancer stages and in adenoma and normal colon tissue. A total of 30 human colon samples were analysed including: different TNM stages (I–IV) from colon adenocarcinomas, colon adenoma compared to human colon healthy tissues (normal colonic mucosa, n = 5; adenoma, n = 5; colorectal cancer, n = 5 of all stages) Scale bar, 200 µm. Black arrows show tumoral tissue and blue arrows show stromal tissue. Five photographs of each tissue were quantified and data are represented as scatter plot. Results are represented as Mean ± SEM for signal intensity scoring per area. Analysis was performed by employing Kruskal-Wallis with Tukey correction test (* p < 0.05).

