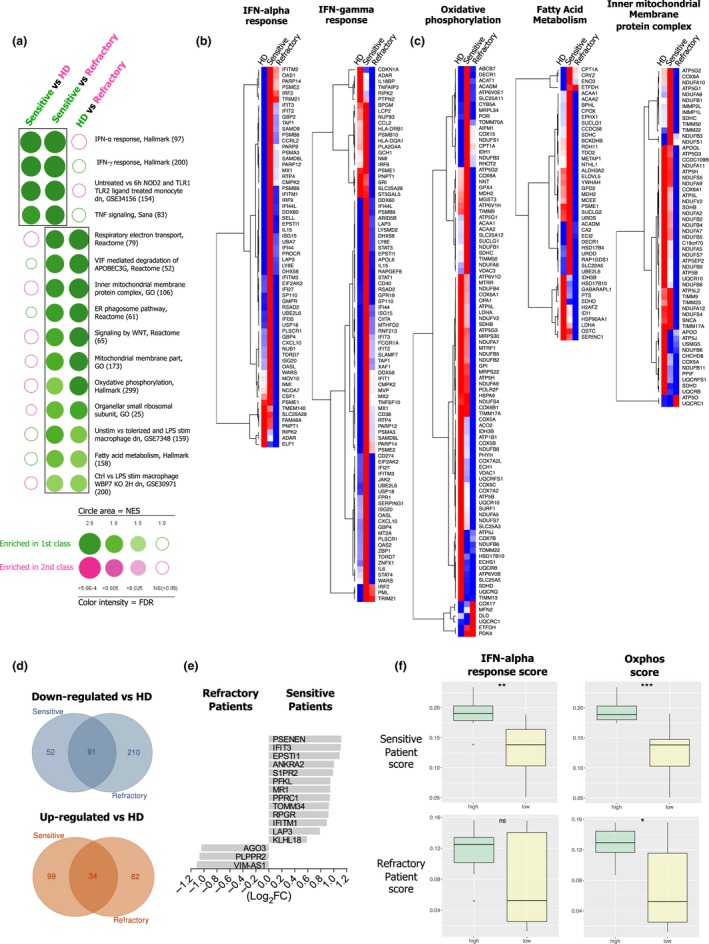
Figure 6.

Monocytes from BC patients sensitive to M1 differentiation process display up‐regulated IFN‐signalling pathways. FACS‐sorted CD14+ blood monocytes from BC patients (sensitive, n = 4; refractory, n = 4) and HDs (n = 8) were submitted to transcriptome analysis. (a) BubbleGUM analysis for enriched sets of genes (GSEA) in sensitive, refractory and HD monocytes. Representative heat‐maps of selected sets of genes associated with (b) IFN‐α and IFN‐γ responses, and (c) oxidative phosphorylation, fatty acid metabolism and inner mitochondria membrane protein complex. (d) Venn diagram of commonly down‐regulated (blue circles) or up‐regulated (red circles) genes in monocytes from sensitive or refractory BC patients versus HDs. (e) Representation of 16 DEGs between sensitive and refractory BC patient monocytes. (f) Single‐sample scoring analysis of the sensitive and refractory signatures in BC patient cohorts from Cassetta et al. 18 stratified according to their type I IFN response or oxidative phosphorylation score.
