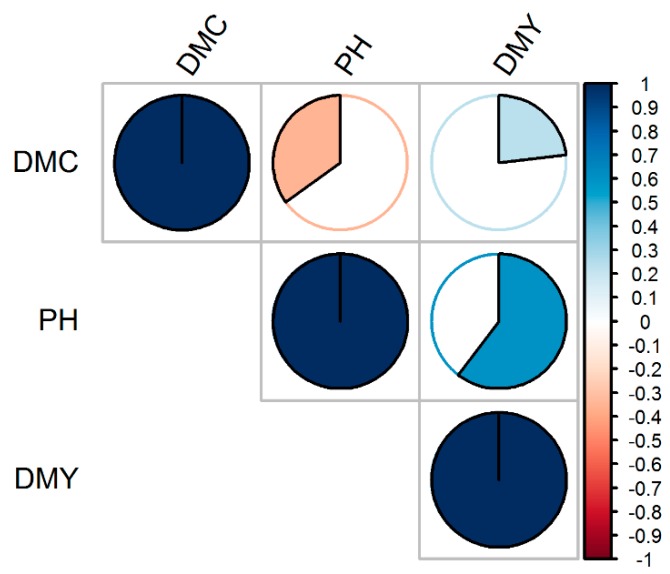
Figure 2.
Pearson correlation coefficients among the evaluated traits. DMC, DMY, and PH, respectively, denote dry mass content, dry biomass yield, and plant height. The filled-in areas of the circles show the absolute value of corresponding correlation coefficients. The scale on the right hand side is colored from red (negative correlation) to blue (positive correlation); with the intensity of color scaled 0%–100% in proportion to the magnitude of the correlation. Refer to text for the description of the traits.

