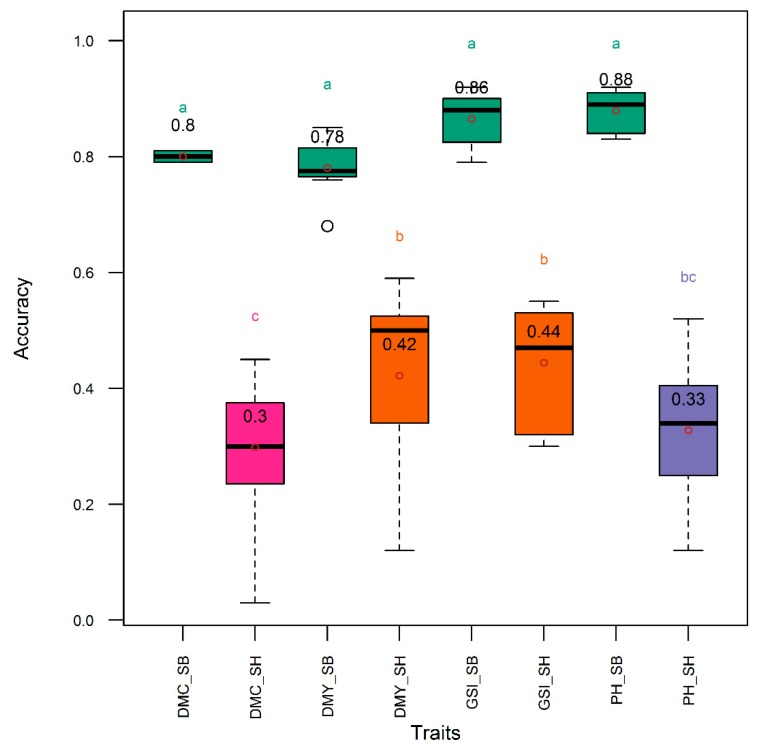
Figure 7.
Distribution (boxplot) of genomic selection accuracy using single traits and all traits simultaneously in Sorghum bicolor and S. bicolor × S. halepense lines. DMC, DMY, GSI, and PH, respectively, denote selection indices relative to dry mass fraction of fresh mass material, aboveground dry biomass yield, all the three traits simultaneously, and plant height. Traits suffixed with “_SB” and “_SH”, respectively, were collected from Sorghum bicolor and S. bicolor × S. halepense lines. Means are indicated by open dots and are included within the boxplot. Means with same letter are not significantly different at the 5% level using the Tukey’s HSD (honestly significant difference) test. Refer to text for the description of the GS models.

