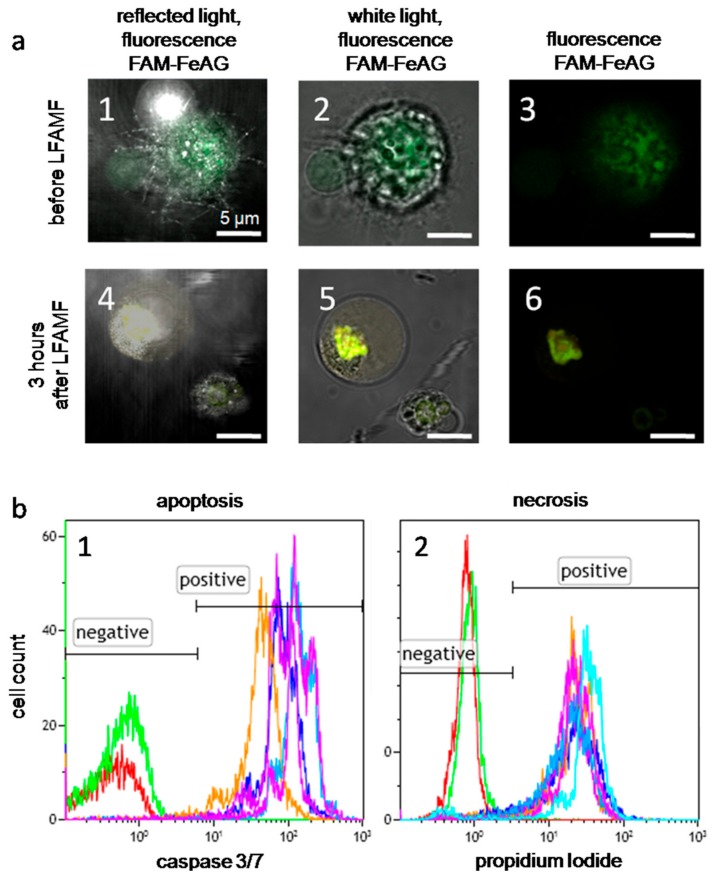
Figure 5.
Effects of AS-FeAG and low frequency alternating magnetic field (LFAMF) in vitro. (a) Fluorescence microscopy of Ehrlich cells with FAM-labeled As-FeAG before and after LFAMF treatment for 10 min represented in reflected light with fluorescence (a1,4), white light with fluorescence (a2,5) and only fluorescence (a3,6). Scale bar: 5 µm. (b1) Flow cytometry analysis of apoptosis 3 h after the treatment using the caspase 3/7 activity; (b2) the level of necrosis determined by propidium iodide accumulation in dead cells. The red curve corresponds to intact cells without staining; the green curve represents the basic level of non-treated cells; purple—to cells treated with FrFeAG (6%); blue—to FrFeAG (4.5%), dark blue—to FeAG (6%), orange—to FeAG (4.7%).

