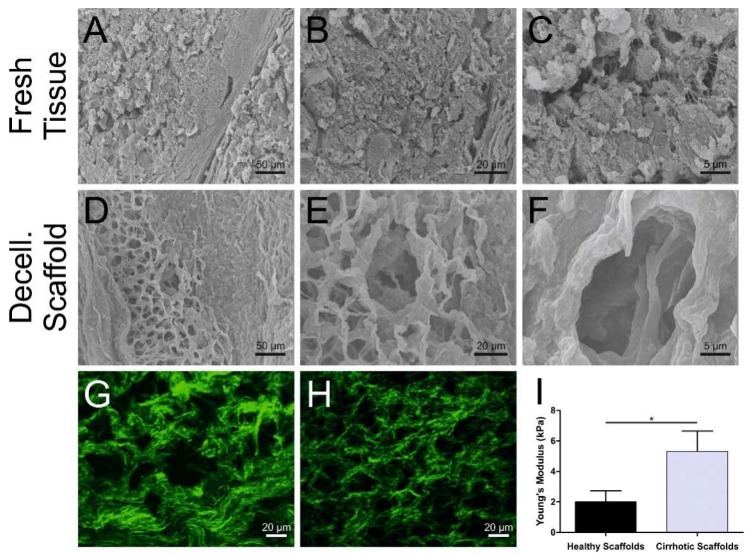
Figure 2.
Microscopic characterization of decellularization of human liver 3D scaffolds. (A–F) SEM imaging of native tissue (top panel, A–C) and decellularized 3D cirrhotic scaffolds (bottom panel, D–F) showing the preservation of the nodular fibrotic ECM and conservation of the hepatocyte pockets (scale bars 50 µm, 10 µm, and 5 μm for each condition). (G) Second harmonic generation analysis of fibrillar collagens structure (green) of healthy decellularized 3D scaffolds with (H) more abundant and compact fibrillar collagen structures present in cirrhotic decellularized 3D scaffolds (scale bars, 20 μm). (I) AFM comparison of tissue stiffness between healthy decellularized 3D scaffolds and cirrhotic decellularized 3D scaffolds: Healthy scaffold 2.03 ± 0.59 kPa and cirrhotic scaffold 5.25 ± 1.09 kPa. Data are expressed as mean ± SEM, * p = 0.0118, unpaired t-test).

