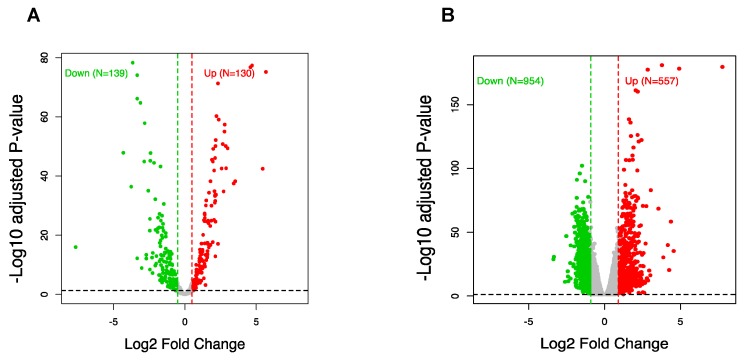
Figure 3.
Differential expression of miRNA and mRNA in neuronal depolarization. (A) Volcano plot generated using fold change values and adjusted p-values [false discovery rate (FDR)] to compare the expression changes of miRNA and (B) mRNA between depolarized and resting cells. Red dots represent significant upregulation and green dots represent downregulation, with the vertical lines corresponding to 1.5-fold (miRNA) and two-fold (mRNA) change and the horizontal line representing an FDR cut off < 0.05.

