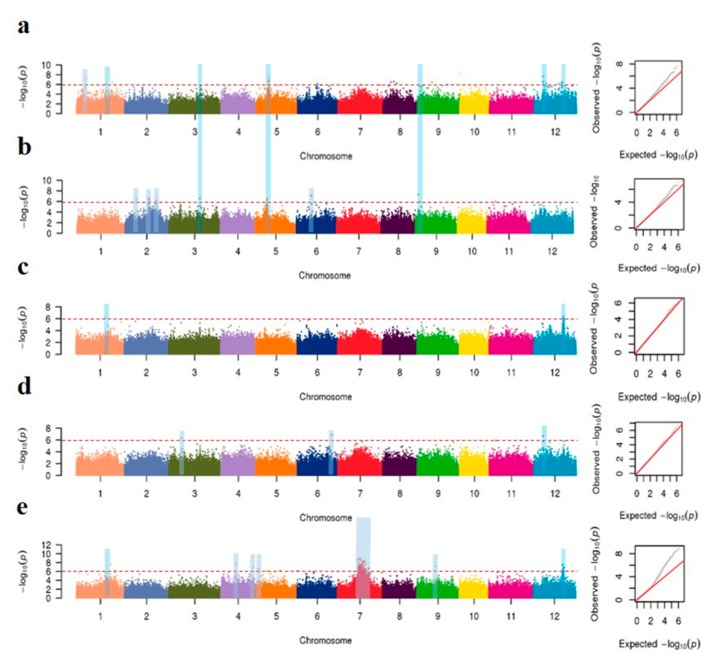
Figure 4.
Genome-wide association studies for mesocotyl length among three culture media. Manhattan plots and Quantile-quantile plots of mesocotyl lengths in sand culture (a), water (b) and soil culture with a sowing depths of 2 cm (c), 4 cm (d) and 6 cm (e), respectively. Negative log10-transformed p values from a genome-wide scan are plotted against position on each of 12 chromosomes. The red horizontal dashed lines indicate the genome-wide significance threshold. Blue stripes show important signals in different GWAS.

