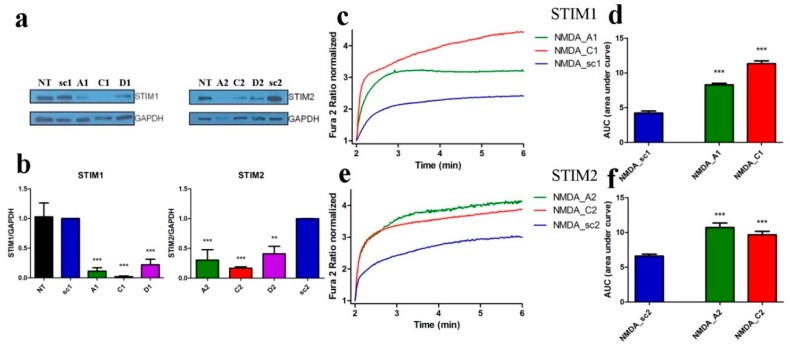
Figure 3.
shSTIM1 and shSTIM2 increase NMDA-induced Ca2+ responses. (a) Western blot analysis of STIM1 and STIM2 protein levels using anti-STIM1 and anti-STIM2 antibodies in cortical neurons transduced with lentiviruses expressing different shRNA sequences directed against RNA for STIM1 (A1, C1, or D1), for STIM2 (A2, C2, or D2) or the control sequence shRNA (sc1, sc2). GAPDH served as reference. (b) Results of quantitative WB analysis of cell lysates obtained from neurons transduced as in (a). Each column shows the mean ± SEM of three independent transductions. Statistical analysis performed by ANOVA, followed by Tukey’s Multiple Comparison Test. NT, non-transduced control, ** p < 0.01; *** p < 0.001. (c–f) NMDAR agonists-induced [Ca2+]i responses increased when expression of STIM1 (c,d) and STIM2 (e,f) is silenced by shA and shC compared to neurons transduced with shsc control plasmid. F340/F380 values just before adding NMDAR agonists normalized to the same values (1). Data represent m number of analyzed cells in n independent experiments that were conducted on three different primary cultures (NMDA_sc1, m = 89, n = 5), (NMDA_A1, m = 98, n = 5), (NMDA_C1, m = 96, n = 7), (NMDA_sc2, m = 104, n = 6), (NMDA_A2, m = 60, n = 7), and (NMDA_C2, m = 92, n = 9). (d,f) Summary of graphs (c,e) shown as an area under the curve (AUC). *** p < 0.001 significantly different compared with NMDA_sc (ANOVA followed by Tukey’s Multiple Comparison Test).

