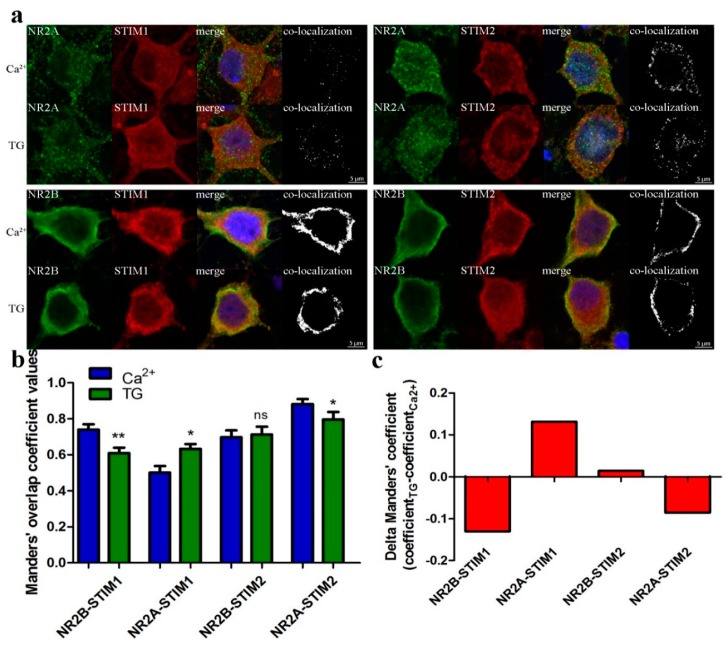
Figure 6.
Endogenous STIMs co-localize with NMDAR2. (a) Representative confocal images of Ca2+ or TG/EGTA-treated neurons fixed and stained with anti-NR2A or NR2B antibody (shown in green, 1st panels), with anti-STIM1 or anti-STIM2 (shown in red, 2nd panels) and with anti-MAP2 to identify neurons for analysis (not shown for clarity). (Blue) Nuclei were stained with Hoechst. The 3rd columns show the merged images of green, red and blue channels. Co-localization of NR subunits with STIM is shown in the 4th columns (white). All images are taken from a single slice from the middle of the cell. Scale bar, 5 µm for each panel. (b,c) Results of co-localization analysis of NRs with STIMs in soma of neurons treated as in (a). Bar graph depicting the quantification of the average value of STIM with NR co-localization coefficient according to Manders (b) or the difference between this coefficient value 10 min after TG treatment and before store depletion (in the presence of 2 mM Ca2+) (c). * p < 0.05; ** p < 0.01; ns, not significant compared with the control (Mann-Whitney U test). Bars represent the average of cultures from three animals; 35–55 cells per each condition (Ca2+ or TG/EGTA).

