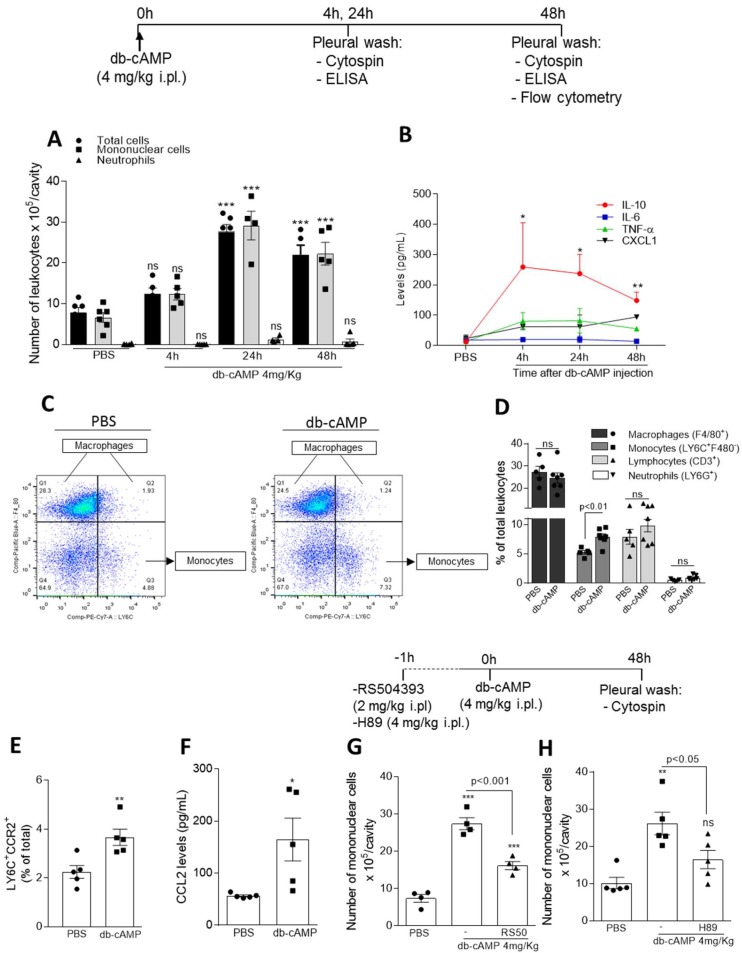
Figure 1.
Time-course of leukocyte recruitment to the pleural cavity of mice after db-cAMP injection and effect of CCR2 and PKA inhibition. BALB/c mice were challenged by an i.pl. injection of db-cAMP (4 mg/kg) and the cells present in the pleural cavity were harvested at 4, 24 and 48 h. Pleural cells were processed for total and differential leukocyte counts of cytospin preparations by light microscopy (A). Levels of cytokines and chemokine (in pg/mL) (B) were measured by ELISA assay in the supernatants obtained from pleural cavity washes after PBS or db-cAMP injection. Flow cytometry analysis of pleural leukocytes collected 48 h after db-cAMP (4 mg/kg) or PBS injection (C,D). Representative dot plots (C) and percentage of lymphocytes, macrophages, monocytes, neutrophils (from the total leukocytes) (D), and monocytes CCR2+ (E). Levels of the chemokine CCL2 (in pg/mL) were measured by ELISA assay in supernatants obtained from pleural cavity washes 4h after db-cAMP injection (F). Mice were also pre-treated for 1 h with RS504393 (2 mg/kg, i.pl.) (G) or H89 (4 mg/kg, i.pl.) (H) and cells from pleural cavity were harvested 48 h after db-cAMP injection for counting of mononuclear cells. Results are expressed as the number of cells per cavity and are shown as the means ± SEM of 4–6 mice in each group. * p < 0.05, ** p < 0.01, *** p < 0.001 when compared with PBS-injected mice.

