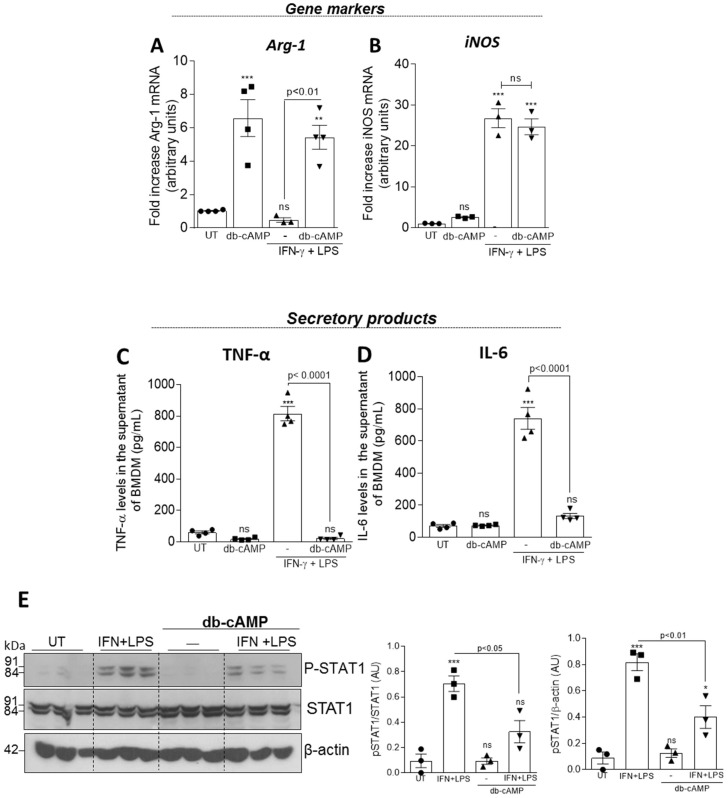
Figure 4.
Effect of db-cAMP on macrophage polarization and STAT1 activation induced by IFN/LPS. BMDMs from BALB/c mice were stimulated with db-cAMP (100 µM), LPS (10 ng/mL) + IFN-γ (10 ng/mL) or were pretreated for 1 h with db-cAMP (100 µM) and then stimulated with LPS (10 ng/mL) + IFN-γ (10 ng/mL) for further 6 h. Cells were collected for measurement of the M2 marker Arg-1 (A) and the M1 marker iNOS (B) by qPCR, and the culture supernatants were used for measurements of the secretory products of M1 - TNF-α (C) and IL-6 (D) by ELISA. In (E) BMDMs were stimulated with LPS (10 ng/mL) + IFN-γ (10 ng/mL), db-cAMP (100 µM), or were pretreated with db-cAMP (100 µM) for 1 h and then stimulated LPS (10 ng/mL) + IFN-γ (10 ng/mL) for 30 min. Cell lysates were subjected to western blot analysis to assess the phosphorylated (pSTAT1) and total STAT1 levels (E). qPCR, ELISA assay and WB densitometry are expressed as fold increase, levels in pg/mL and arbitrary units, respectively, and are shown as the mean ± SEM. * p < 0.05 ** p < 0.001, *** p < 0.0001 when comparing with untreated (UT) BMDMs.

