
Figure 7.
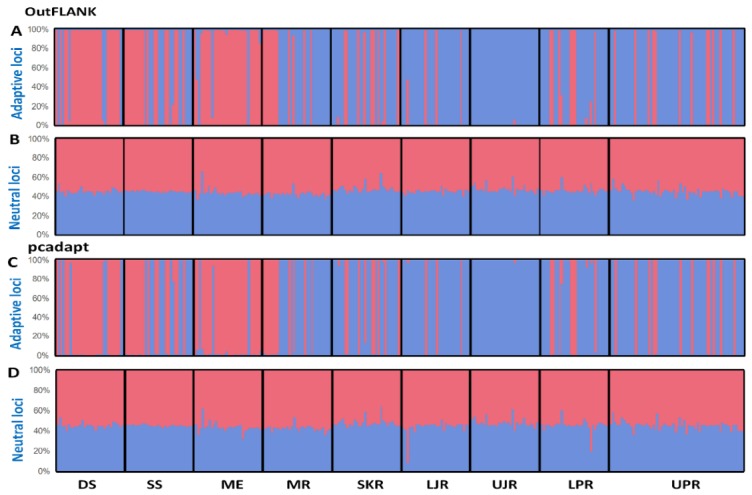
Bayesian STRUCTURE bar plot, based on the (A,B) FST OutFLANK approach for the 74 putatively adaptive SNP loci (A) and 15,379 putatively neutral SNP loci (B); and (C,D) pcadapt approach for the 449 putatively adaptive panel of SNP loci (C) and 15,004 putatively neutral panel of SNP loci (D). Black lines separate the individuals of different populations. Each vertical line represents an individual. The colors represent the proportion of inferred ancestry from the K ancestral populations. Based on the delta K statistic, the best-supported number of a posteriori genetic clusters was K = 2 for the standard admixture model. DS, deep sea; SS, shallow sea; ME, Meghna estuary; MR, Meghna river; SKR, Surma–Kushiara river; LPR, lower Padma river; UPR, upper Padma river; LJR, lower Jamuna river; UJR, upper Jamuna river.