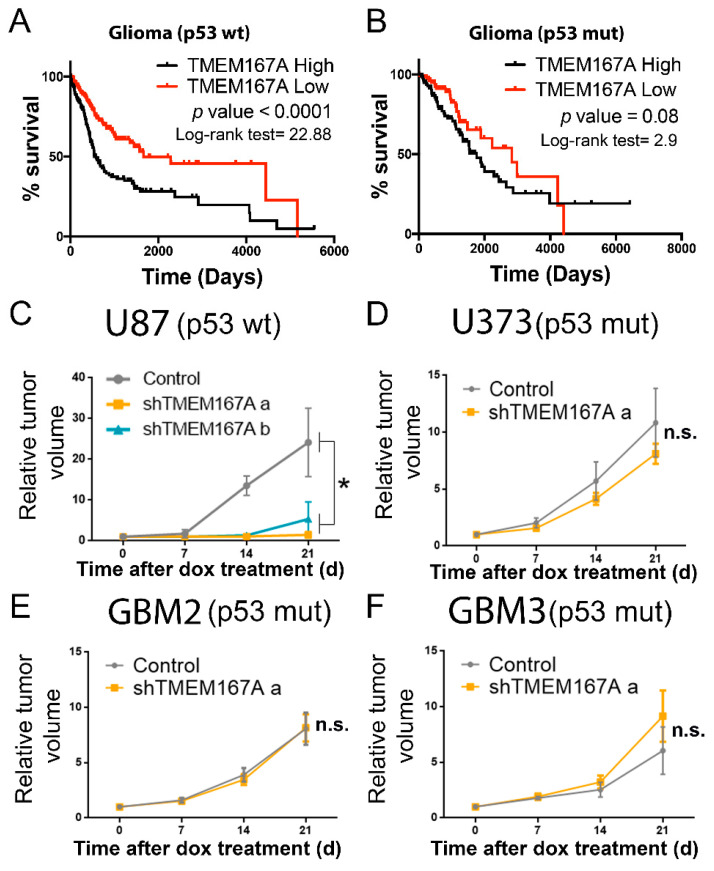
Figure 3.
TMEM167A expression correlates with tumor aggressiveness in wild-type but not in mutant p53 gliomas. (A,B) Kaplan–Meier overall survival curves of patients from the Rembrandt LGG–GBM cohort. Patients were separated on the basis of the TP53 status: p53 wt (A) and p53 mut (B). Then they were stratified into two groups on the basis of TMEM167A expression values. (C–F) Subcutaneous tumor growth assay of U87 (C), U373 (D), GBM2 (E), and GBM3 (F) cells expressing shControl (Control) or shTMEM167A (shTMEM167Aa and shTMEM167Ab) (n = 6/group). The graphs were represented as fold increase in tumor volume. * p ≤ 0.05, n.s. = nonsignificant.

