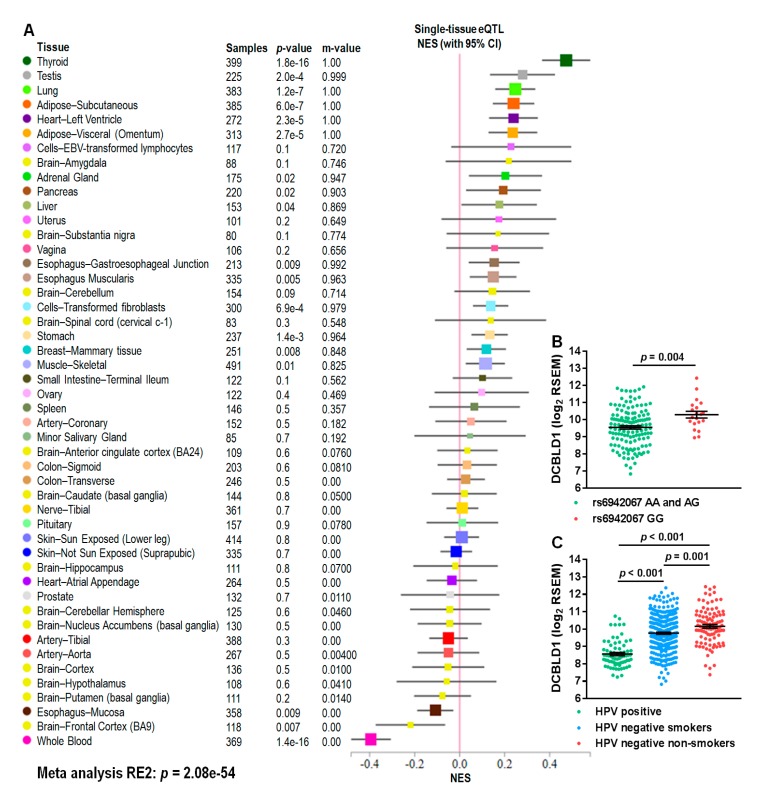
Figure 2.
DCBLD1 gene expression, rs6942067, and HNSCC risk factors. (A) Multi-tissue expression quantitative trait locus analysis of rs6942067 and DCBLD1 using the GTEx project and the Han and Eskin’s random effects model (RE2). (B,C) Comparison of DCBLD1 gene expression for (B) rs6942067 AA and AG (n = 135) or rs6940267 GG (n = 20) and (C) HPV positive (green, n = 71), HPV negative smokers (blue, n = 334), or HPV negative non-smokers (red, n = 101) patients of the TCGA HNSCC cohort. Mean and standard error are shown.

