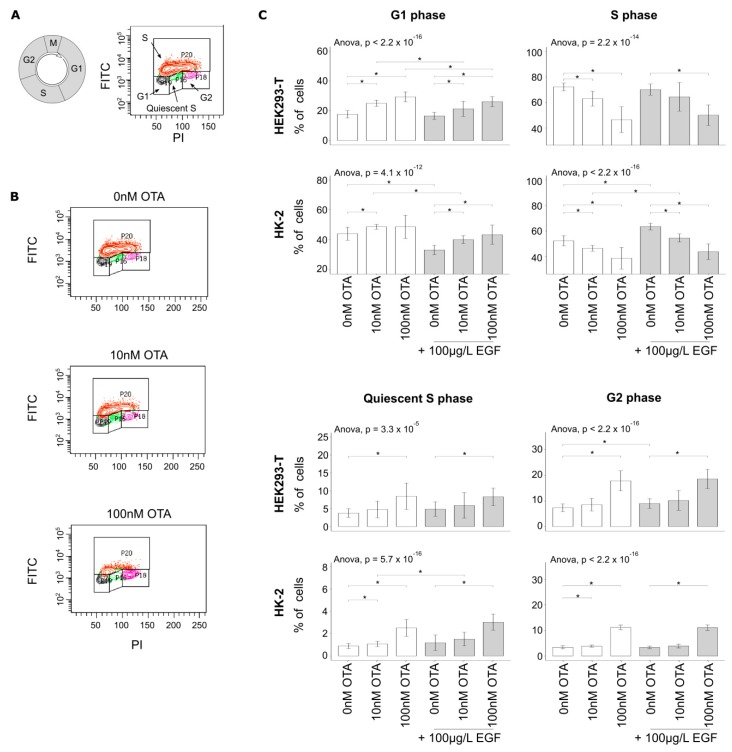
Figure 2.
Gap 1 and 2 (G1 and G2) cell-cycle arrests were induced by different concentrations of OTA. (A) Illustration of the strategy used to determine the percentages of cells in each population. (B) Example of OTA-induced changes in the distribution of cell populations (here in HEK293-T cells). Anti-5-bromo-2-deoxyuridine (BrdU) antibodies were coupled with fluorescein isothiocyanate (FITC). (C) Cells were exposed to different concentrations of OTA and epidermal growth factor (EGF). We excluded the samples that were not stained properly (visual selection) and the outliers (statistics-based selection). Pairwise t-test and multi-testing were performed (mean ± SD, * p < 0.05, N = 5, n = 11–15). See also Figure S5 (Supplementary Materials).

