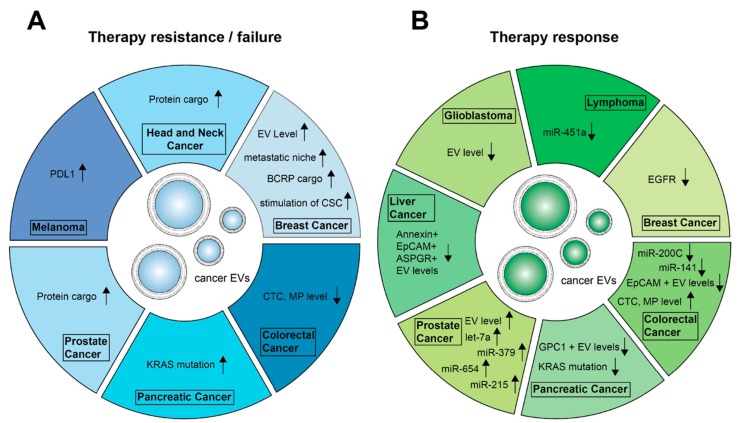
Figure 1.
Approaches to monitor therapies by EVs and their cargo. Shown changes were associated with therapy resistance or failure (A) in contrast to changes seen if the cancer is responding to therapy (B) ↑: increase, upregulation; ↓: decrease, downregulation; EV level↑: Increase in EV concentration; miR: microRNA; CTC: circulation tumor cells; CSC: cancer stem-like cells; MP: microparticles.

