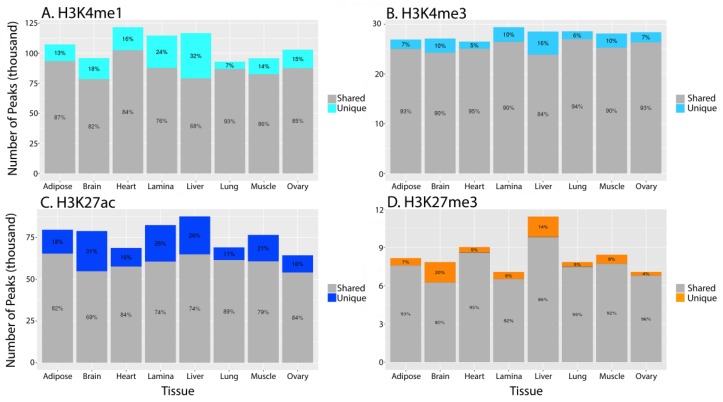
Figure 3.
Tissue-specific peaks for each histone mark. Grey area indicates the number of peaks for a particular histone tail modification that are shared between at least two tissues, while the color region of each bar indicates the number of tissue-specific peaks. Percentage values are also assigned to the two segments of each bar to indicate the proportion of shared and unique peaks. (A) H3K4me1, (B) H3K4me3, (C) H3K27ac, (D) H3K27me3 from SICER.

