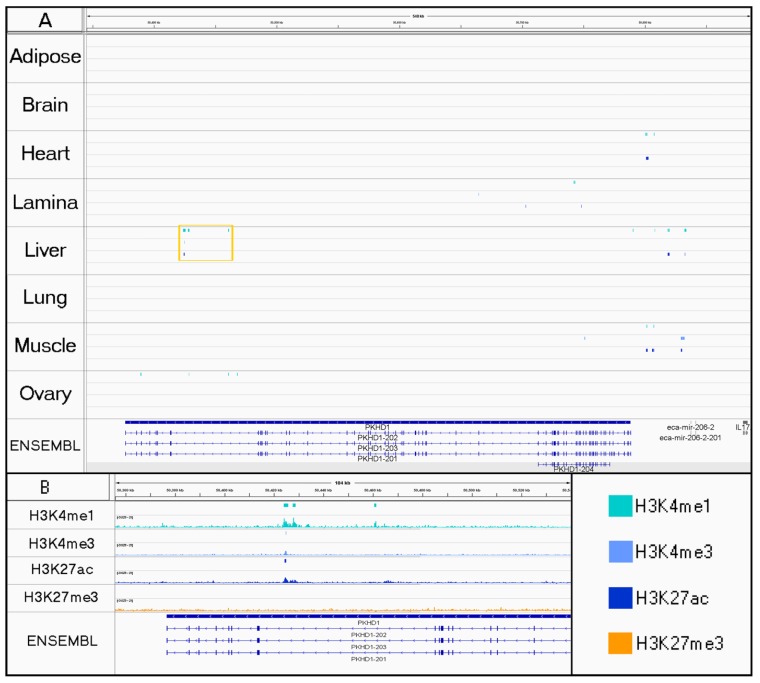
Figure 4.
Evidence of a tissue-specific regulatory element found in liver tissue. For each tissue, peaks are displayed for H3K4me1 (aqua), H3K4me3 (light blue), H3K27ac (dark blue), and H3K27me3 from SICER (orange). (A) Gold box highlights liver-specific active marks in the 59th intron of an annotated gene, PKHD1 (Ensembl Transcript ID: ENSECAT00000024985.1), which is transcribed from the antisense strand. H3K4me1 marks were also detected in ovary tissue at the end of the gene, but they do not indicate the presence of an active enhancer without co-occurrence of H3K27ac. (B) Enrichment profiles (BigWig) were visualized below the corresponding peak tracks for the region highlighted by the gold box in A.

