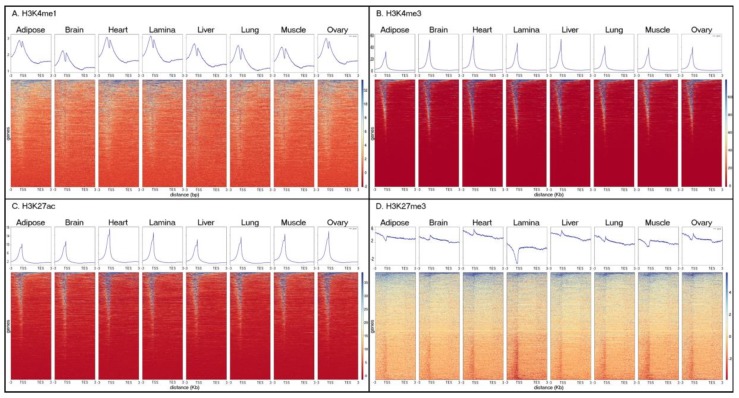
Figure 6.
Histone mark enrichment across the average annotated gene body. (A) H3K4me1, (B) H3K4me3, (C) H3K27ac, (D) H3K27me3 from SICER. Topology plots (top) and heat maps (bottom) show average enrichment of each histone mark in each tissue across a size-normalized gene distribution based on the Ensembl (Release 95) annotation for EquCab3.0. Each line in the heatmap represents mark enrichment across a given gene, such that red indicates low relative enrichment and blue indicates high relative enrichment.

