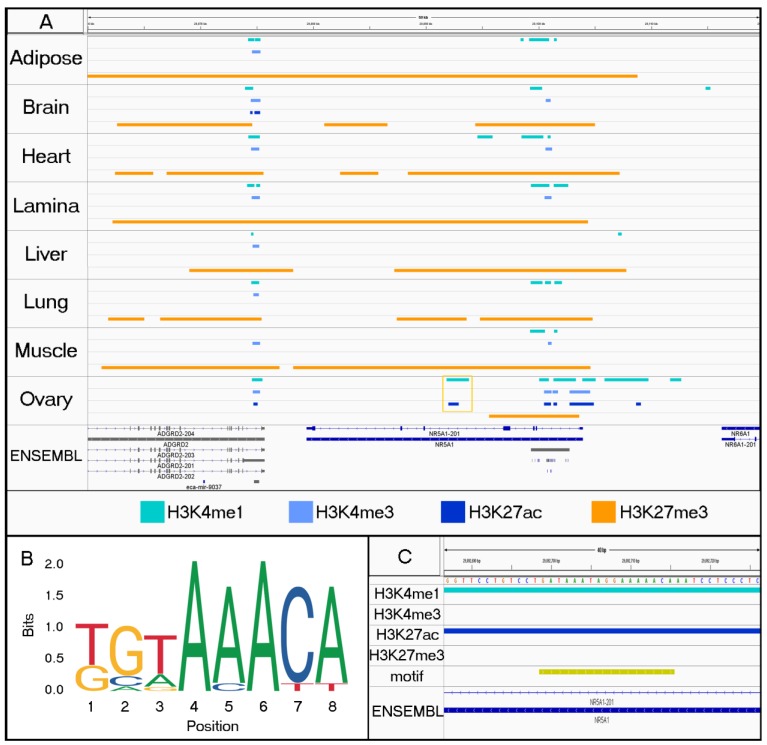
Figure 7.
Localizing enriched TF binding motifs within tissue-specific peaks. For each tissue, peaks are displayed for H3K4me1 (aqua), H3K4me3 (light blue), H3K27ac (dark blue), and H3K27me3 from SICER (orange). Gold box highlights ovary specific marks in intron of NR5A. (B) Motif logo displays one of the major motifs for FOXO3. (C) Zoomed in view of 40 bp within region highlighted in (A). The gold track indicates the presence of two nearly consecutive motifs for FOXO3 within the H3K4me1 and H3K27ac peaks that were detected only in ovary tissue.

