Figure 8.
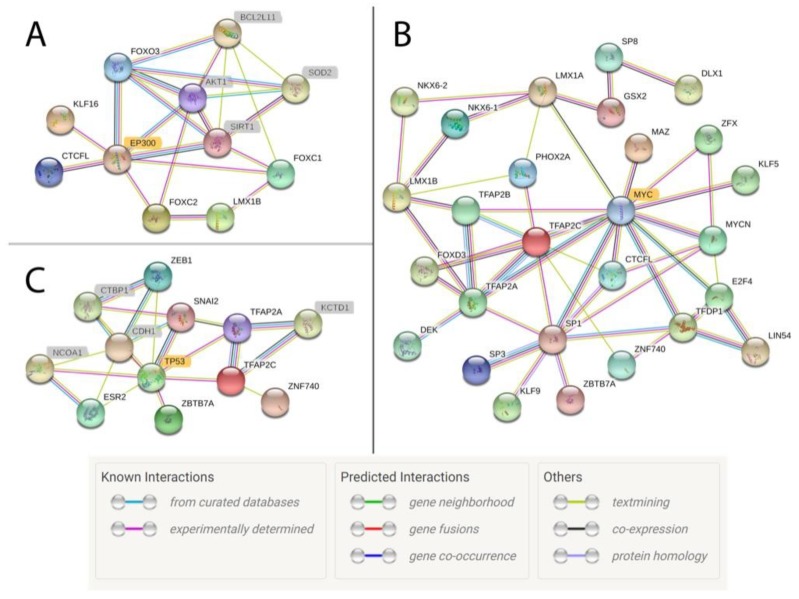
Network of transcription factor interactions based on active motif regions in ovary, skeletal muscle, and lung tissues. Each circle represents a protein, and lines indicate interactions between proteins. Each line color indicates a different type of evidence for the interaction. Protein names highlighted in grey were not identified in the horse ChIP-seq data but were identified as secondary factors by the network analysis based on implicated or known protein–protein interactions from research in humans and mice. (A) EP300 is highlighted in gold to denote its central role in the network for ovary tissue. (B) MYC is highlighted in gold to indicate its central role in the network for muscle tissue. (C) TP53 is highlighted in gold to indicate its central role in the network for lung. Legend is from String Software [47].

