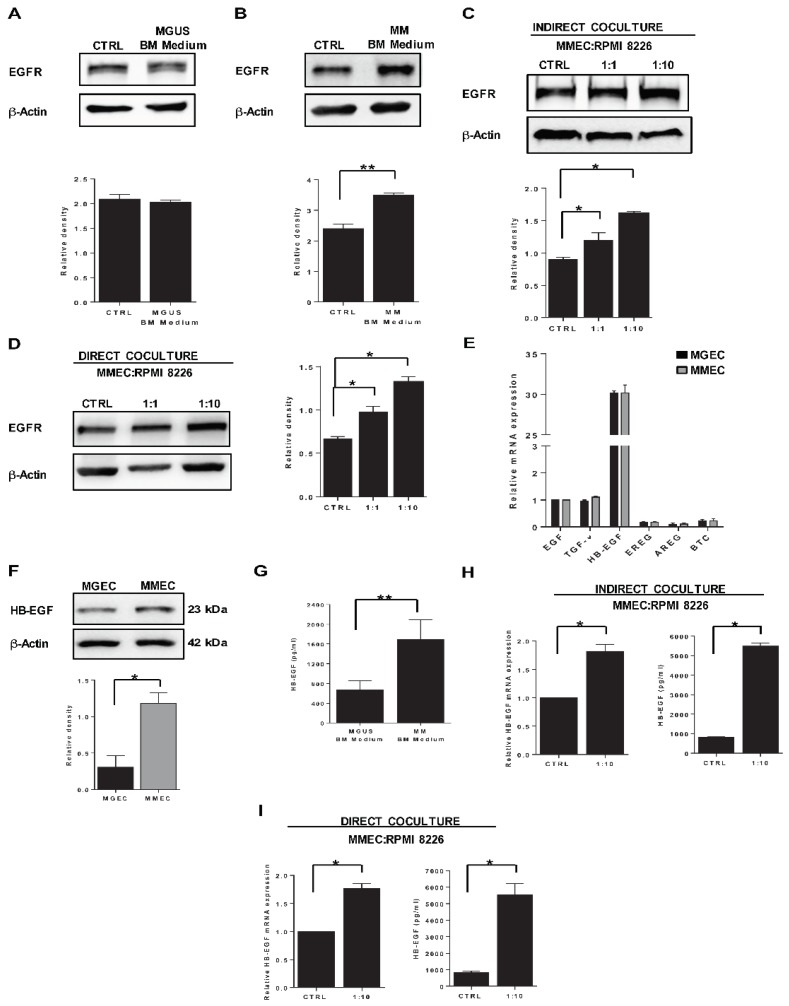
Figure 2.
Bone marrow microenvironment influences EGFR and HB-EGF expression in MMEC. Western blots of EGFR and ≥β-actin in MMEC and results of densitometric analyses of EGFR normalized to β-actin. (A,B) MMEC were maintained for 24 h in normal culture medium (CTRL) or culture medium conditioned by bone marrow mononuclear cells (BMMC) from (A) MGUS patients (MGUS BM medium) or (B) MM patients (MM BM medium). (C,D) MMEC were grown for 24 h, alone (CTRL) or in coculture with RPMI 8226 cells at 1:1 and 1:10 cell ratios, separated (C) or not (D) by Transwell inserts. All charts report data from six patients. Each sample was tested in triplicate with similar results. (E) Basal relative mRNA levels of six EGFR ligands in MGEC and MMEC, determined by real-time PCR. Values were normalized to that of EGF. Samples from six MGUS and six MM patients were tested in triplicate. (F) Western blots of HB-EGF and β-actin in MGEC and MMEC, and results of densitometry analysis of HB-EGF, normalized to β-actin. Samples from six MGUS and six MM patients were tested in triplicate. (G) ELISA determination of HB-EGF in conditioned culture medium from BMMC of 12 MGUS and 12 MM patients. (H,I) Relative HB-EGF mRNA levels (left) and ELISA determinations of soluble HB-EGF in conditioned medium (right) of MMEC cultured for 24 h, alone (CTRL) or in coculture with RPMI 8226 cells, indirectly (H) or directly (I). Samples from six patients were tested in triplicate. Values are expressed as mean and SD, * p < 0.05 and ** p < 0.01, Mann–Whitney U test.

