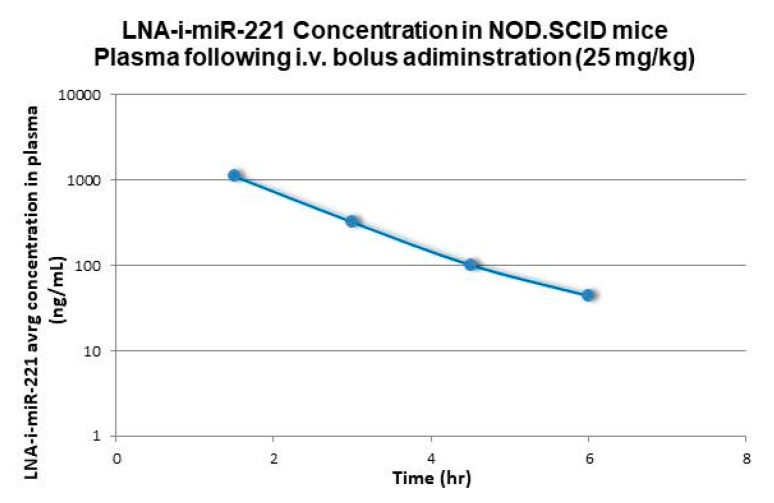
Figure 3.
plasma concentration versus time profiles (sparse sampling) following single intravenous (bolus) administration at 25 mg/kg to NOD.SCID mice (semi logarithmic scale). Plasma concentrations at 12h and 24h were below the limit of quantification (LLQ = 25ng/mL). Mouse PK was not used for the allometric extrapolation (see main text for details).

