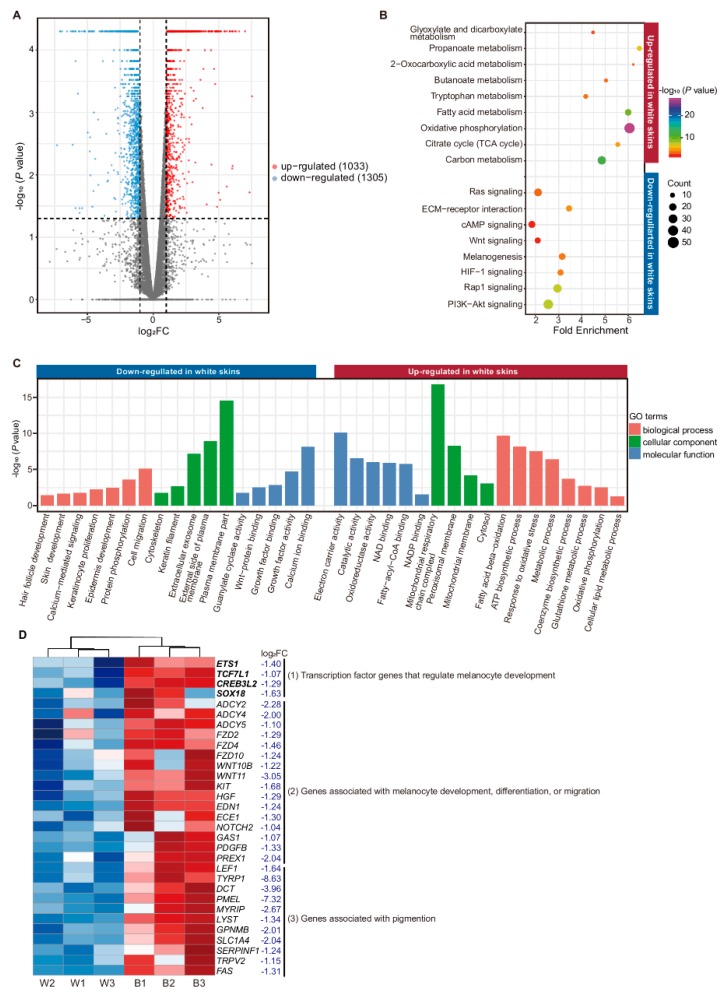
Figure 3.
Enrichment analysis of differentially expressed (DE) mRNAs. (A) Volcano plot for 2338 DE genes, of which 1305 were down-regulated in white skins, while 1033 were up-regulated. (B) Functional enrichment analysis of the KEGG pathway (genes down-regulated in white skin were marked blue and up-regulated marked red; Benjamini corrected p-value < 0.05). (C) Gene ontology (GO) enrichment analysis (genes down-regulated in white skin marked blue and up-regulated marked red p-value < 0.05). (D) Identification of genes associated with melanogenesis. The genes in bold are transcript factor genes (cluster (1)).

