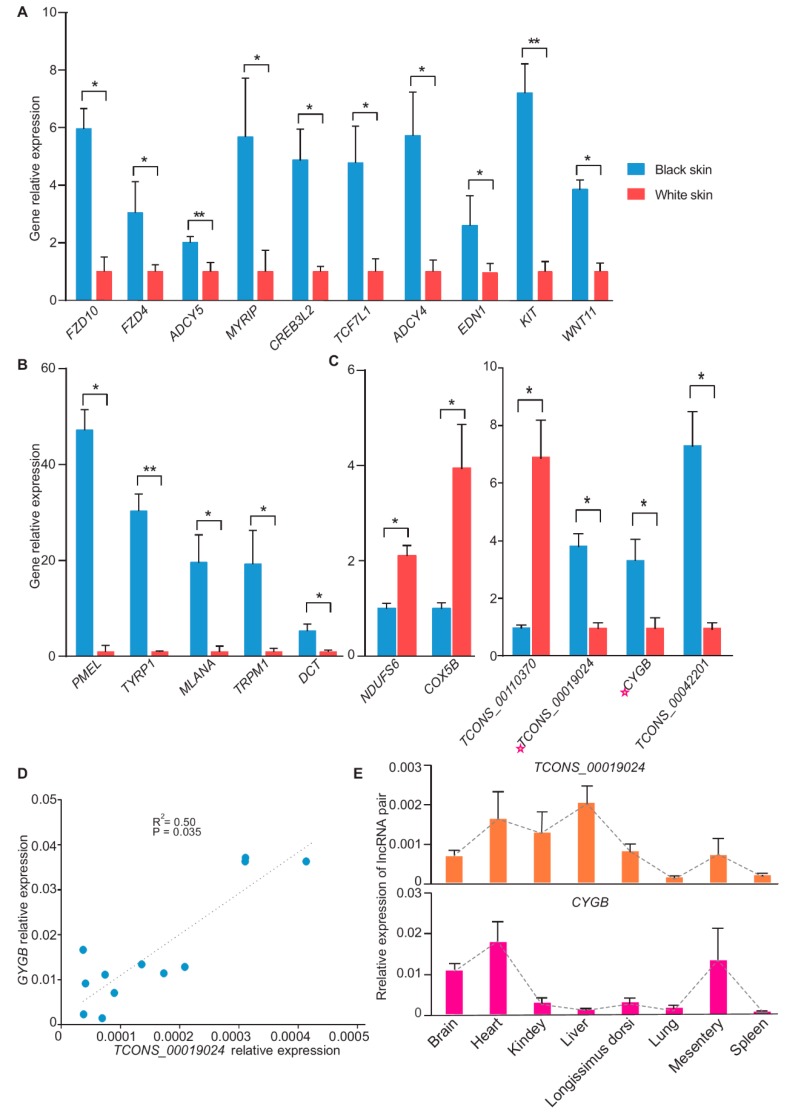
Figure 5.
RT-PCR validation of the differentially expressed mRNAs and lncRNAs. (A) RT-PCR validation results of 10 coat color genes (n = 3). (B) RT-PCR validation results of melanocyte-specific expression gene (n = 3). (C) RT-PCR validation results of mRNA and lncRNA that were differentially expressed in the skin (n = 3). The lncRNA TCONS_00019024 and its target gene CYGB were marked utilizing a pink star. (D) Correlation curve of TCONS_00019024/CYGB. RT-PCR data from skins were used to create a correlation curve (n = 6). Linear correlation coefficient of TCONS_00019024/CYGB was 0.71 (R2 = 0.50, p = 0.035). (E) Relative expression of TCONS_00019024 and CYGB in 8 tissues (n = 3). * p-value < 0.05. ** p-value < 0.01.

