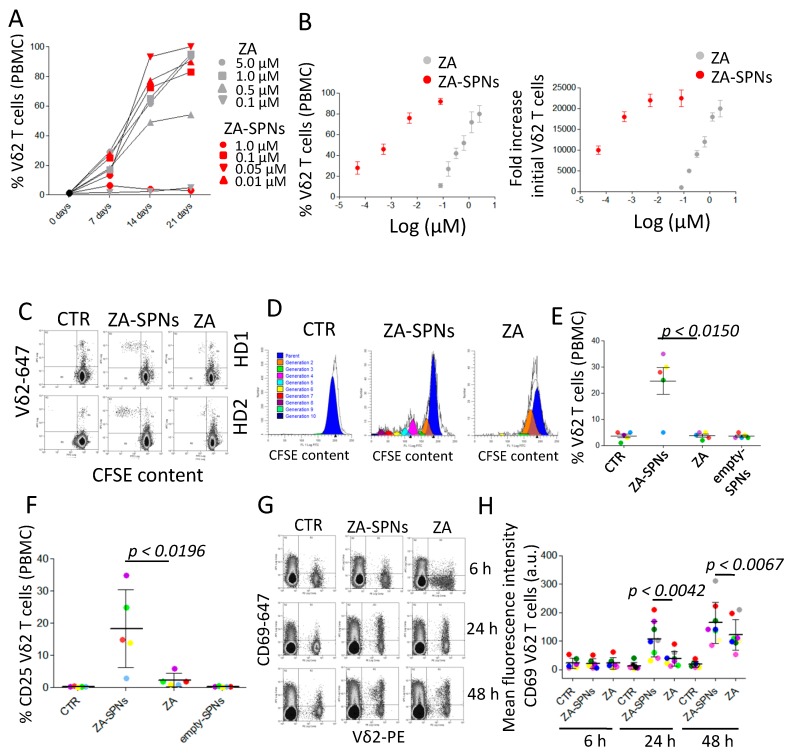
Figure 2.
ZA-SPNs stimulated the expansion and activation of Vδ2 T lymphocytes. (A) PBMCs were incubated with ZA-SPNs (red) or soluble ZA (gray) at the indicated concentrations (μM) for 24 h before the addition of interleukin (IL)-2. The percentage of Vδ2 T lymphocytes was evaluated at different time points (7, 14, and 21 days) using fluorescence activated cell sorter FACS analysis. One representative experiment out of 10 is shown. (B) Left graph: PBMCs were incubated with ZA-SPNs (red) or soluble ZA (gray) (Log μM) for 24 h before the addition of IL-2. The percentage of Vδ2 T lymphocytes (2.5 ± 1.2% in the starting PBMCs) was evaluated on day 21 using FACS analysis. Mean ± SD of 10 healthy PBMCs. Right graph: Results of the left graph expressed as a fold increase of Vδ2 T lymphocytes/mL at the end of the culture compared to the initial number. Mean ± SD of 10 PBMCs. (C) Carboxyfluorescein succinimidyl ester (CFSE)-labeled PBMC from two representative donors (HD1, HD2) were cultured without (CTR) or with ZA-SPNs (0.05 μM) or soluble ZA (1 μM), without the addition of exogenous IL-2, and the decrease of CFSE intensity (green) was evaluated on day 7. Vδ2 T cells were identified with the specific mAb (red). (D) Vδ2 T cell proliferation, elicited as in (C), evaluated using the CFSE decrease in gated Vδ2 T cells with the ModFit LT5.4 software. CTR: CFSE content in cells with the medium alone. Experimental representative of five replicates performed. (E) Vδ2 T cell proliferation to ZA-SPNs or ZA or empty SPNs (same nanoparticle amounts as for the ZA-SPNs) elicited as in (C) in five donors; mean ± SD also shown. CTR: medium alone. (F) Expression of the IL-2Rα chain (CD25) at 48 h using FACS analysis on Vδ2 T lymphocytes in the indicated experimental conditions (CTR: medium alone; ZA-SPNs: 0.05 µM; ZA: 1.0 µM; empty SPNs). Results are expressed as a percentage of CD25+ cells in gated Vδ2 T lymphocytes. (G,H) PBMCs cultured as in (C) for 6 h, 24 h, or 48 h were stained with the anti-Vδ2 and anti-CD69 mAbs and analyzed using FACS. Quadrants: lower-left—CD69−Vδ2− cells; upper-left—CD69+ cells; upper-right—CD69+Vδ2+ cells; lower-left—Vδ2+ cells. In (H), PBMCs stained as in (G) and evaluated as the mean fluorescence intensity (MFI, a.u.) of CD69 expression on Vδ2 T cells at 6 h, 24 h, and 48 h. Mean ± SD from eight donors’ PBMCs. CTR: medium alone.

