Figure 4.
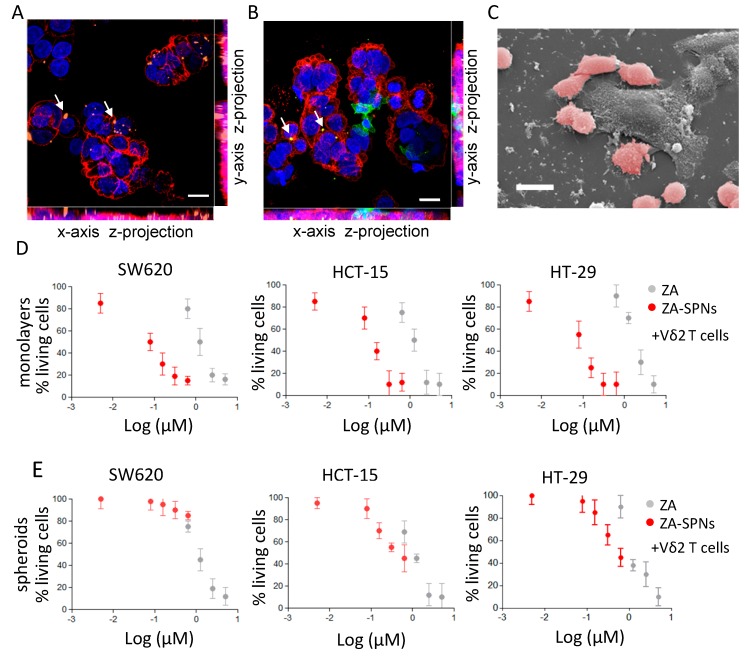
ZA-SPNs triggered the cytotoxicity of colorectal carcinoma (CRC) cell lines and spheroids using Vδ2 T cells. (A) Representative confocal microscopy image showing Cy5-conjugated ZA-SPNs’ (orange, arrows) internalization in CRC cells, identified using the anti-EPCAM mAb and Alexafluor555 isotype-specific goat antimouse (GAM) (red). Blue: nuclei diamidino phenylindole (DAPI) staining. Scale bar: 10 µm. (B) Vδ2 T cells identified using the specific anti-Vδ2 mAb and Alexafluor488-anti-isotype GAM (green) interacting with CRC (EPCAM followed by Alexafluor555 GAM, red) previously exposed (24 h) to ZA-SPNs (white arrows). Blue: DAPI nuclear staining. Scale bar: 10 µm. (C) SEM images of a similar experiment in which Vδ2 T cells (pink) had surrounded a CRC (gray). Scale bar: 20 µm. (D) The CRC cell lines SW620, HCT-15, and HT-29 were cultured adherent in flat bottomed plates with ZA-SPNs (red) or with soluble ZA (gray) at different concentrations and challenged with activated Vδ2 T cells from healthy donors at the effector:target (E:T) ratio of 3:1 for 48 h. Then, viability was assessed using a crystal violet assay. Data is expressed as a percentage of living cells as compared to cells cultured in medium alone, are the mean ± SD of three independent experiments of six different replicates for each condition. (E) Spheroids of the CRC cell lines SW620, HCT-15, and HT-29 at day 5 were incubated with activated Vδ2 T cells at the E:T ratio of 3:1 and either ZA-SPNs (red) or soluble ZA (gray) at the indicated concentrations for 48 h. Spheroid cell viability was assessed using crystal violet assay modified as described in Varesano et al. [45]. Data are the mean ± SD of three independent experiments of six replicates for each condition.

