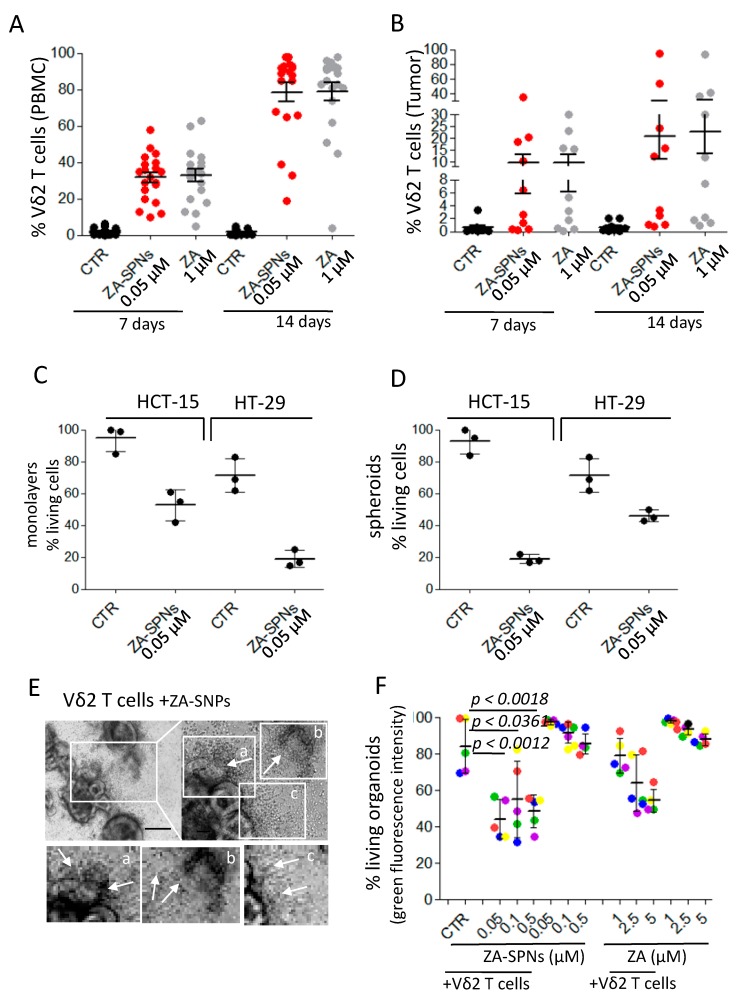
Figure 5.
ZA-SPNs triggered the expansion of CRC patients’ Vδ2 T lymphocytes to be able to kill CRC spheroids and autologous organoids. (A) PBMC from CRC patients were cultured with ZA-SPNs (0.05 µM) or soluble ZA (1.0 µM) and 10 ng/mL (30 IU/mL) IL-2. The percentage of Vδ2 T lymphocytes was evaluated using FACS analysis on days 7 and 14. Vδ2 T cells in the starting PBMCs: 1.4 ± 1.6%, mean ± SD of 20 patients. (B) Tumor cell suspensions were cultured as in (A), and Vδ2 T lymphocyte expansion was determined on days 7 and 14. Results are expressed as percentages of Vδ2 T lymphocytes as mean ± SD of 10 patients’ specimens. Vδ2 T cells in the starting tumor-derived populations: 0.04 ± 0.05% (mean ± SD of 10 patients). (C,D) HCT-15 or HT-29 as adherent cells (C) or spheroids (D) were incubated with ZA-SPN-expanded Vδ2 T cells obtained from the PBMCs of three CRC patients. ZA-SPNs (0.05 µM) were further added or not (CTR) at the onset of the 48 h assay. E:T ratio was 3:1. Data expressed as a percentage of living CRC cells (crystal violet staining) as mean ± SD of six replicates/condition in three independent experiments. (E) Representative co-cultures of ZA-SPN-expanded Vδ2 effector T cells and the autologous OMCR-016TK organoids exposed to ZA-SPN. Upper-left image: 100×. Scale bar: 100 µm. Upper-right image: 200×. Lower panels: enlargements of quadrants a, b, and c in the upper-right panel. Asterisks in each panel: organoids. Arrows in each panel: Vδ2 T cells invading organoids (c, one almost destroyed in b) or in their neighborhood (c). (F) Organoids from five patients (OMCR18-006TK, green; OMCR18-006TK, red; OMCR19-006TK, blue; OMCR19-009TK, yellow; OMCR19-016TK, purple) were labeled with calcein-acteoxy methyl ester (AM) and challenged with autologous ZA-SPN-expanded Vδ2 T cells for 6 days without ZA-SPNs (CTR) or in the presence of ZA-SPNs or soluble ZA at the indicated concentrations. E:T ratio was 3:1. Fluorescence of each culture well was quantified using spectrofluorometry and compared to that of organoid cultures considered to be 100%. Data expressed as a percentage of green fluorescence as mean ± SD of three independent experiments with six replicates/condition. The p-values of ZA-SPNs versus CTR are shown.

