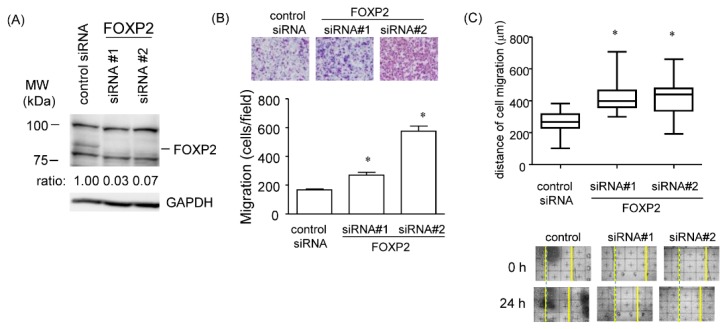
Figure 8.
Promotion of cell migration in FOXP2 knockdown cells. (A) Amounts of FOXP2 protein in non-MG cells treated with two siRNAs targeted to distinct FOXP2 sequences were measured using western blotting with GAPDH as a loading control. (B) Upper panels show representative images of Diff-Quick staining in four experiments of transwell migration assays, and a lower graph shows quantification of cell migration expressed by cell counting. Data are expressed as the mean ± standard deviation (SD; n = 4). * Statistically significant difference versus control (unpaired Student’s t-test, p < 0.05). (C) Scratch assay was performed in non-MG cells with FOXP2-siRNA treatment. Migration distance was measured 24 h after cells were scratched. Representative images were shown in lower panels. Data are expressed as the mean ± standard deviation (SD; n = 4). * Statistically significant difference versus control (unpaired Student’s t-test, p < 0.05). MW, molecular weight.

