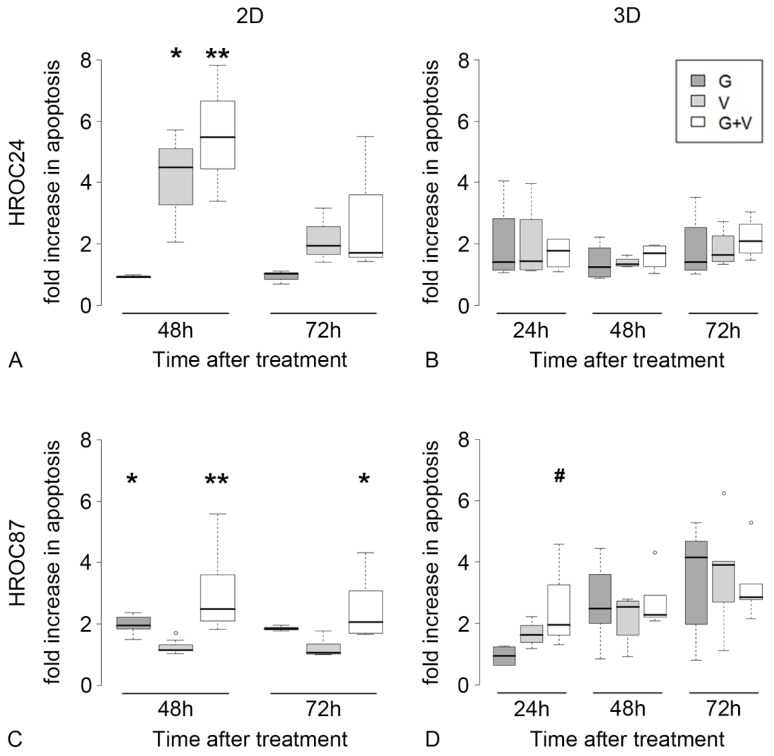
Figure 4.
Apoptosis rates in HROC24 versus HROC27 cells in 2D and 3D. We compared apoptosis rates (fold increase to untreated controls) of gefitinib treatment (G), vemurafenib (V) or their combination (G + V). HROC24 cells respond to monotherapy with vemurafenib in 2D as well as to the combination-therapy (A). In contrast, HROC87 cells respond to gefitinib monotherapy in 2D as well as to the combination-therapy (C). In 3D, both drugs are not able to significantly induce apoptosis, neither in monotherapy nor in combination-therapy in HROC24 (B) and in HROC87 cells (D). #: 0.05 < p < 0.1, *: 0.01 < p < 0.05, **: p < 0.01. ° denotes outliers.

