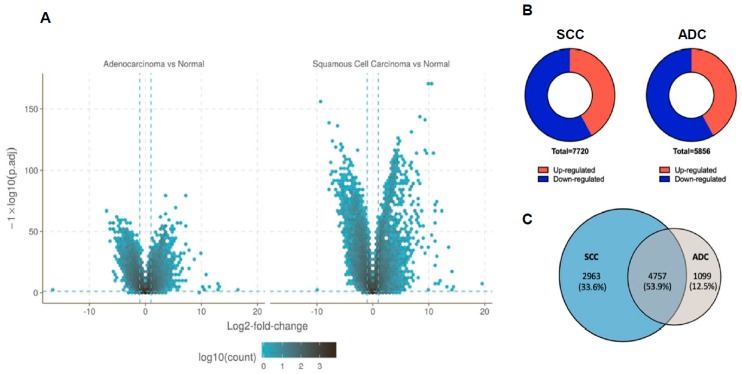
Figure 1.
Differential gene expression in squamous cell carcinoma (SCC) and adenocarcinoma (ADC). (A) Volcano plot of differentially expressed genes (DEGs) in each subtype of non-small-cell lung carcinoma (NSCLC). The horizontal line at false discovery rate (FDR) = 0.05; vertical line at |log2FC| = 1; (B) Pie charts represent the numbers of genes found to be upregulated or downregulated. (C) Venn diagram shows overlap between differentially expressed genes in SCC and ADC. The numbers of DEGs include both up- and down-regulated genes in tumour tissue compared to normal tissue.

