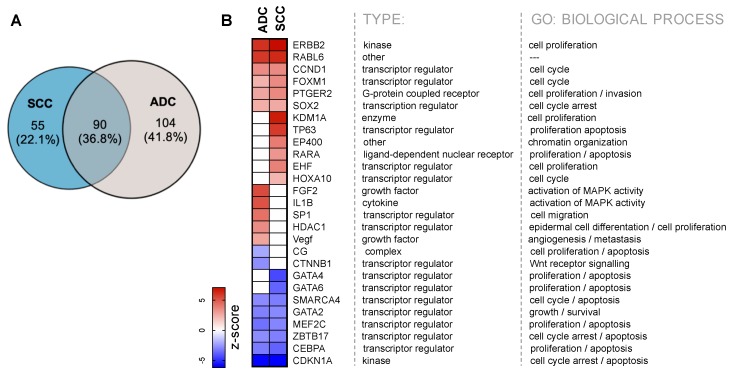
Figure 5.
IPA-predicted top 20 upstream regulators of gene expression in SCC and ADC. (A) Venn diagram showing the number of upstream regulators (FDR ≤ 0.01) in squamous cell lung carcinoma (SCC) and the number of overlapping regulators between these both subtypes of NSCLC. (B) The heat map shows the predicted activation and inhibition states of categorised molecules in IPA as transcription regulators, growth factors, cytokines, kinases and others. Colours in heat map indicate z-scores.

