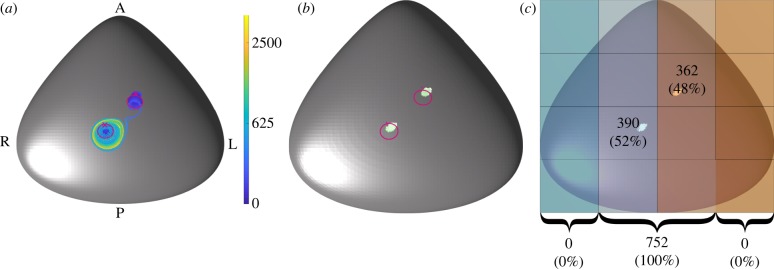
Figure 4.
Results for particles released directly from the cilia of the biciliated mouse node. (a) The simulated tracks, coloured according to time in beats, with the cilia location marked with crosses and paths traced out by the cilia tips shown in magenta. (b) The deposition location of the particles is shown, with (c) showing the node divided into 12 regions, with the number (and percentage) of particles deposited within these regions indicated. At the bottom of (c), the number (and percentage) of particles deposited in the far left, centre and far right of the node is shown.

