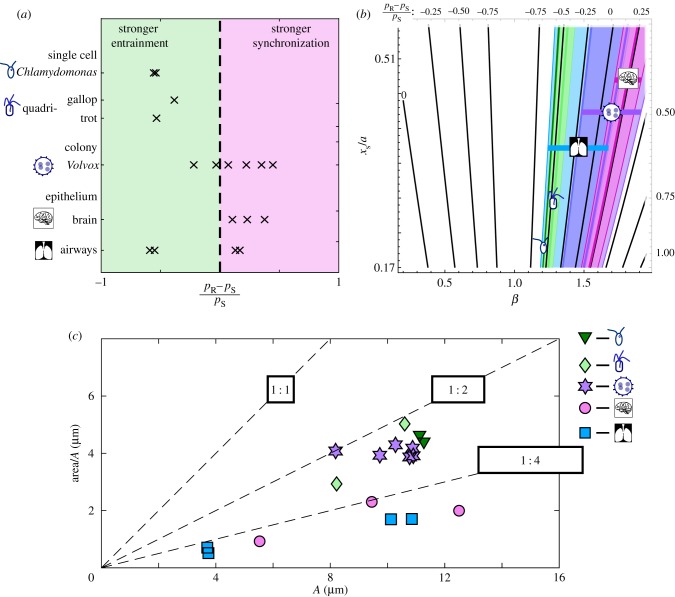
Figure 5.
Rower approximations of different types of flagella give a range of values for the relative strength of mutual synchronization with regards to entrainment, with Volvox and epithelial cilia exhibiting a skew towards mutual synchronization. (a) The relative synchronization strength measured with respect to the entrainment detuning range (pR − pS)/pS. Positive values (pink region, right) indicate stronger coupling between oscillators than can be achieved through entrainment, and vice versa for negative values (green region, left). Results were obtained for Chlamydomonas, quadri-flagellated algae, Volvox, mouse brain, and human airway cilia. (b) The range of values measured for each flagellum type is overlaid onto the contour map calculated for power law potentials. Each range is labelled with a cartoon marker and a unique colour. Dark green—Chlamydomonas, light green—quadri-flagellates, blue—airways, purple—Volvox and pink—brain. The horizontal bars accompanying markers are aids to distinguish each range. (c) Comparing the elongation of the different trajectories. The width of each trajectory is defined as the area within the fitted trajectory/ellipse divided by the amplitude. Reference lines are included to separate the plot, with a square, a 1 : 2 rectangle and a 1 : 4 rectangle in black labelling the respective lines. The epithelial trajectories are more elongated, being clustered below 1 : 4. The different algae are grouped below 1 : 2, which is consistent with an elliptical trajectory with the same ratio. (Online version in colour.)

