Figure 5.
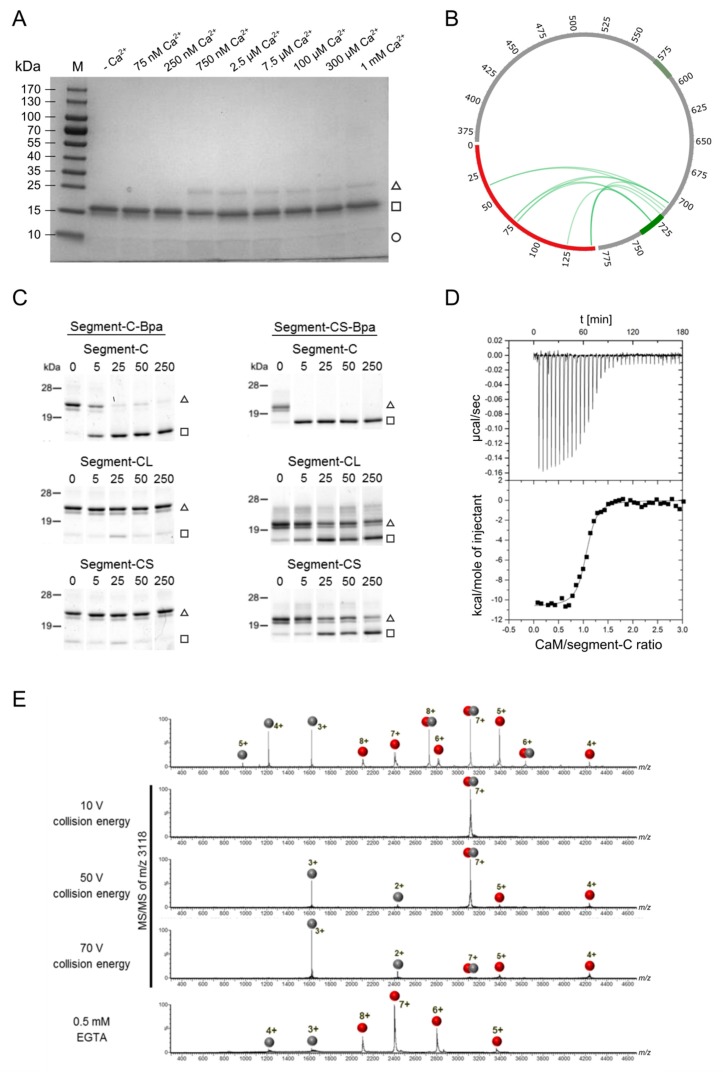
Complex formation between CaM and the segment-C. (A) Ca2+ concentration required for complex formation. The Coomassie stained gradient (4–20%) SDS-PAGE gel illustrates cross-linking of the CaM/segment-C complex at increasing Ca2+ concentrations. Buffer and cross-linking conditions were identical to Figure 2. The complex was covalently connected by photo-cross-linking via the incorporated photo-Met in CaM. (M) Prestained Protein Ladder, (□) CaM, (○) segment-C and (∆) CaM/segment-C 1:1 complex. (B) Identified cross-links between CaM and segment-C. All cross-links are illustrated as a Circos plot within the whole segment-A for comparison with previous results. CaM is colored in red, segment-A in gray and the binding sites in light and dark green within the segment-A. (C) PAL-based competition assay of segment-C-Bpa and segment-CS-Bpa with segment-C, -CS and -CL. (□) CaM, (∆) CaM/segment-C-Bpa or CaM/segment-CS-Bpa 1:1 complex. Complete SDS gels and corresponding mass spectra are shown in Figure S10. (D) Affinity measurements. ITC experiments were performed at 6.14 µM Ca2+, applying CaM in the reaction cell and segment-C in the syringe. A binding event was detected for N = 1.04, KD = 43 ± 8 nM, ΔH = 10.68 ± 0.17 kcal·mol−1 and ΔS = −2.12 cal·mol−1·K−1. (E) Native ESI-MS. The ITC sample (CaM and segment-C) was subjected to buffer exchange prior to mass spectrometric analysis. The sample was analyzed in the absence (upper panel) and presence of EGTA (lower panel). MS/MS experiments were performed for the 7+ charged precursor ion of the complex at m/z 3118. CaM is depicted as red spheres and segment-C as gray spheres.

