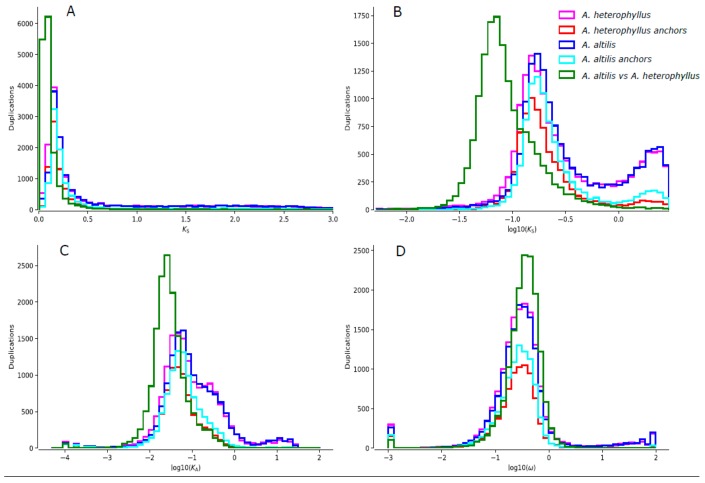
Figure 2.
A graph showing the A. heterophyllus Ks distributions (pink) and the Ks distributions of its anchor pairs (red), A altilis Ks distributions (dark blue) and the distributions of its anchor pairs (light blue) overlaid with the Ks distributions of the one-to-one orthologs of A. heterophyllus, and A. altilis (green). (B) log transformed version of (A). (C,D) are the log transformed Ka and ω distributions, respectively.

