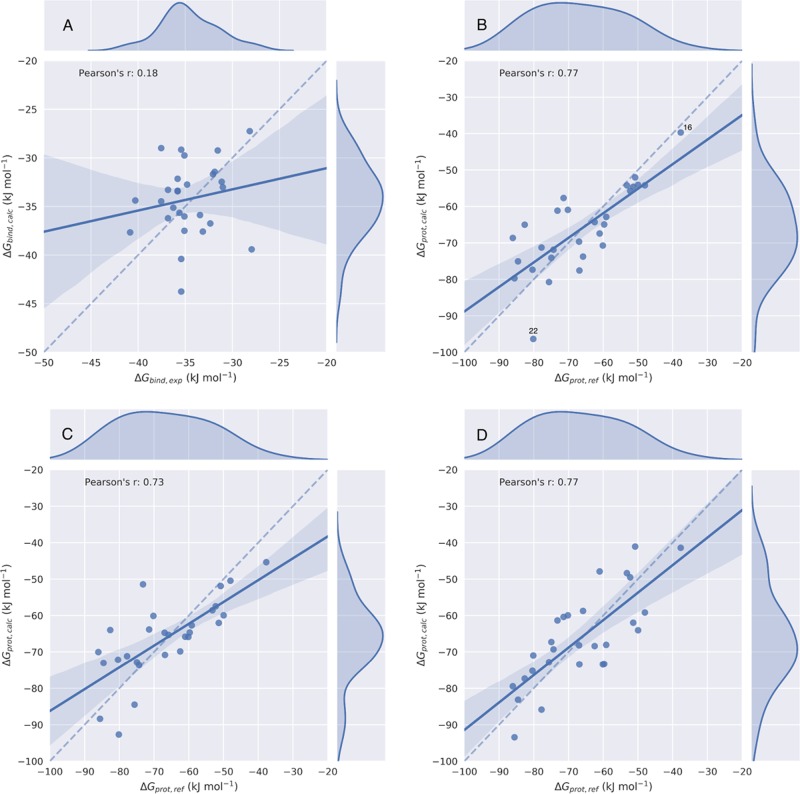
Figure 3.
Scatter and kernel density plots of the LIE (A), ALIE1 (B), ALIE2 (C), and ALIE3 (D) models for CYP2A6 binding, illustrating obtained correlations between calculated free energies ΔGbind,calc or ΔGprot,calc and their respective reference values. Dashed lines indicate an ideal correlation between the calculated and reference data, solid lines indicate the actually obtained correlations, and shaded areas indicate 95% confidence intervals.

