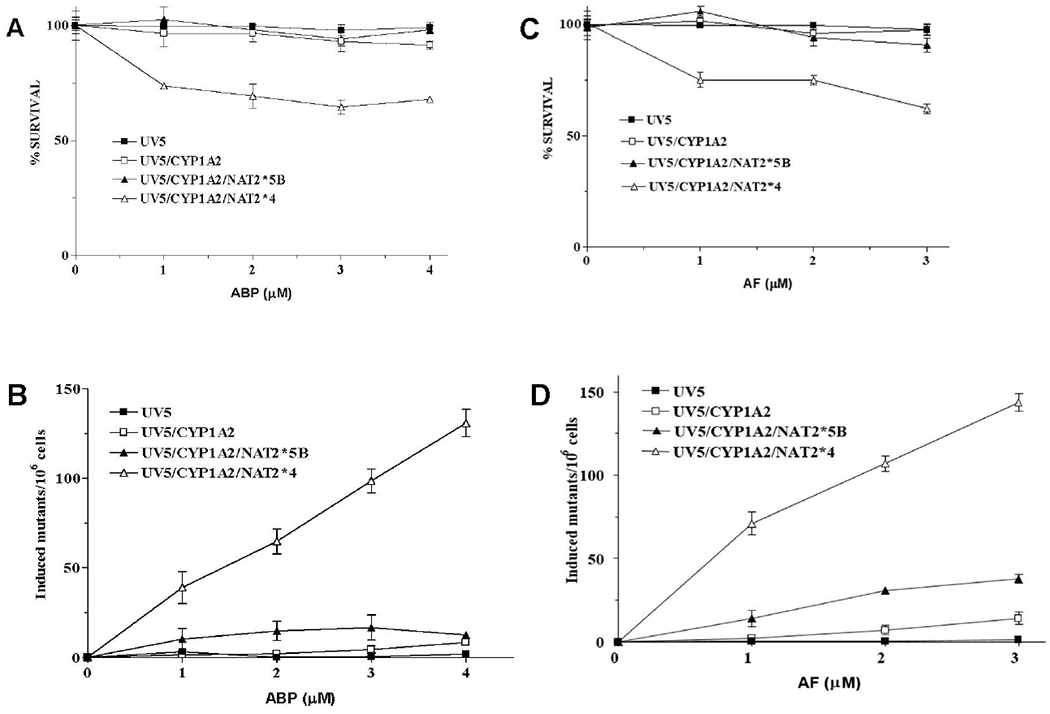
Figure 2.

Cytotoxicity and hprt mutants. Percent survival measured by colony forming ability plotted for each of the four UV5 CHO cell lines following treatment with ABP (A) or AF (C). Data represent Mean ± SEM for two independent experiments. hprt mutant fractions following treatment with ABP (B) or AF (D). Data presented as Mean ± SEM for 4 independent experiments. Error bars not shown fall within the symbol. The UV5/CYP1A2/NAT2*4 cells had significantly more (p < 0.001) hprt mutants as compared to all other cell lines following treatment with ABP or AF at each concentration tested. The UV5/CYP1A2/NAT2*5B cells had significantly more hprt mutants than the UV5 and UV5/CYP1A2 cells following treatment with 2.0 μM (p < 0.001) or 3.0 μM (p < 0.01) AF.
