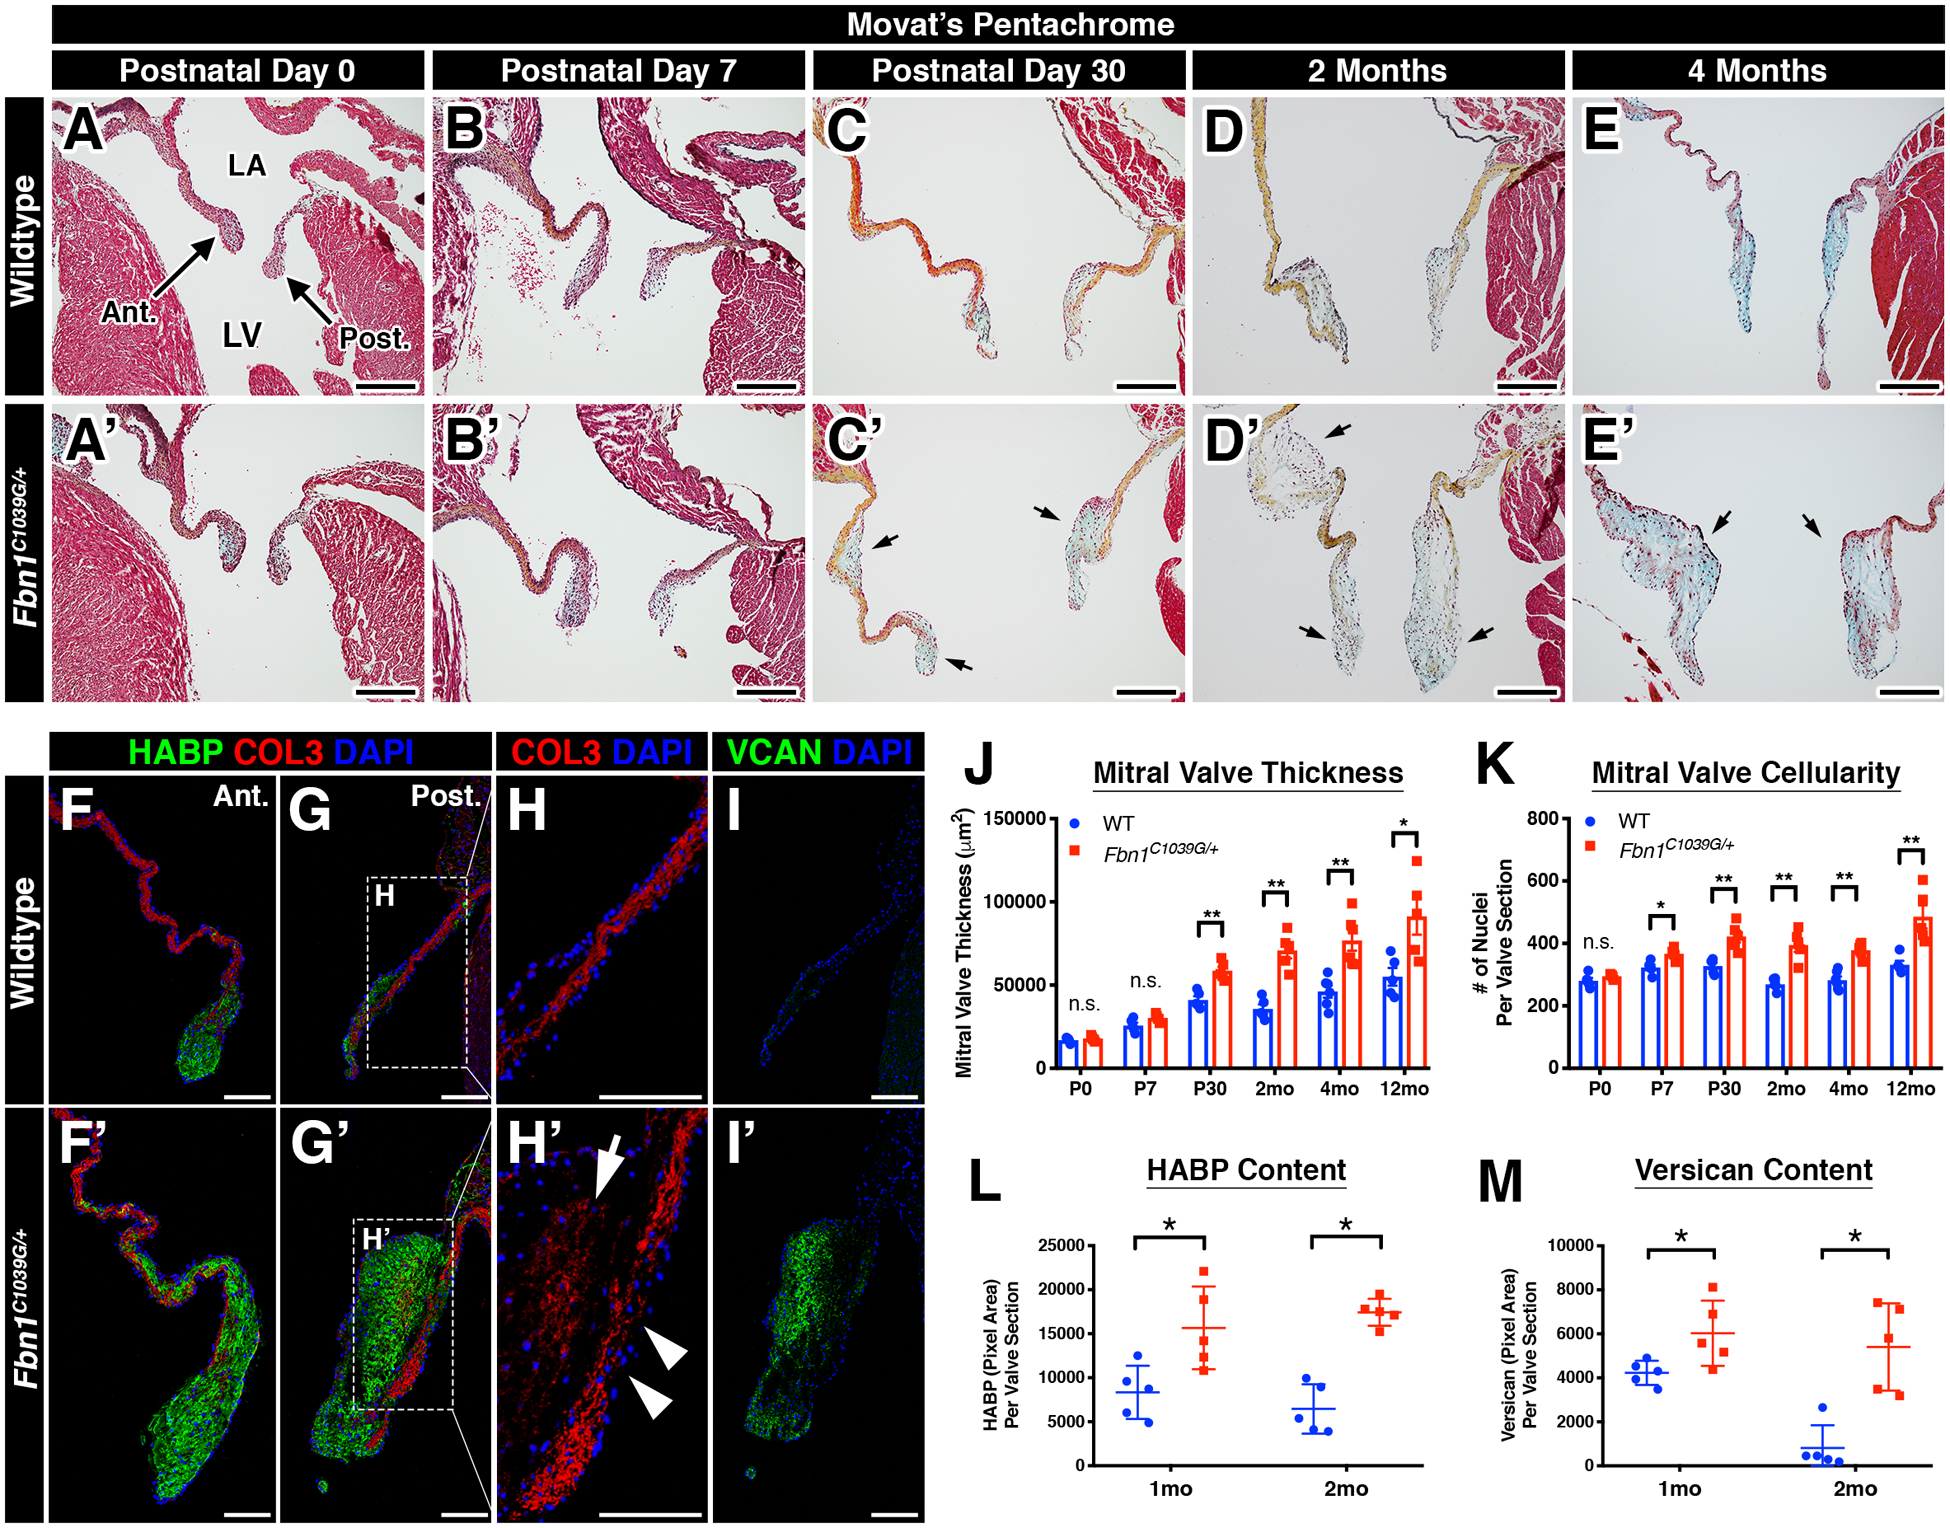
FIGURE 1: Mitral valves undergo abnormal post-natal maturation in Marfan syndrome mice.

A-E’: Representative histologic images of the mitral valve at multiple timepoints in wildtype (A-E) and Marfan syndrome (A’-E’) mice using Movat’s pentachrome staining. Note that mitral valve leaflet thickening is detected (arrows) beginning at P30 in Marfan syndrome mice (C’) versus control (C). LA = left atrium; LV = left ventricle. F-I’: Diseased mitral valves exhibit ECM abnormalities, including increased HABP (green; F’, G’), collagen fragmentation (arrowheads; H’), collagen deposition (arrow; H’), and increased versican (green; I’) versus controls (F- I). The posterior leaflet is depicted. J-M: Quantification of mitral valve thickness (J), overall cellularity (K), HABP (L), and versican (M). Data are represented as mean ± SEM. *p<0.05; **p<0.01. n.s. = not significant. n=6–8 mice/genotype/timepoint. Scale Bars = 200μm (A-E’) and 100μm (F-I’). Abbreviations: Ant.=Anterior leaflet; Post.=Posterior leaflet; LA=Left Atrium; LV=Left Ventricle; HABP=Hyaluronan Binding Protein; COL=Collagen; VCAN=Versican; mo=month.
