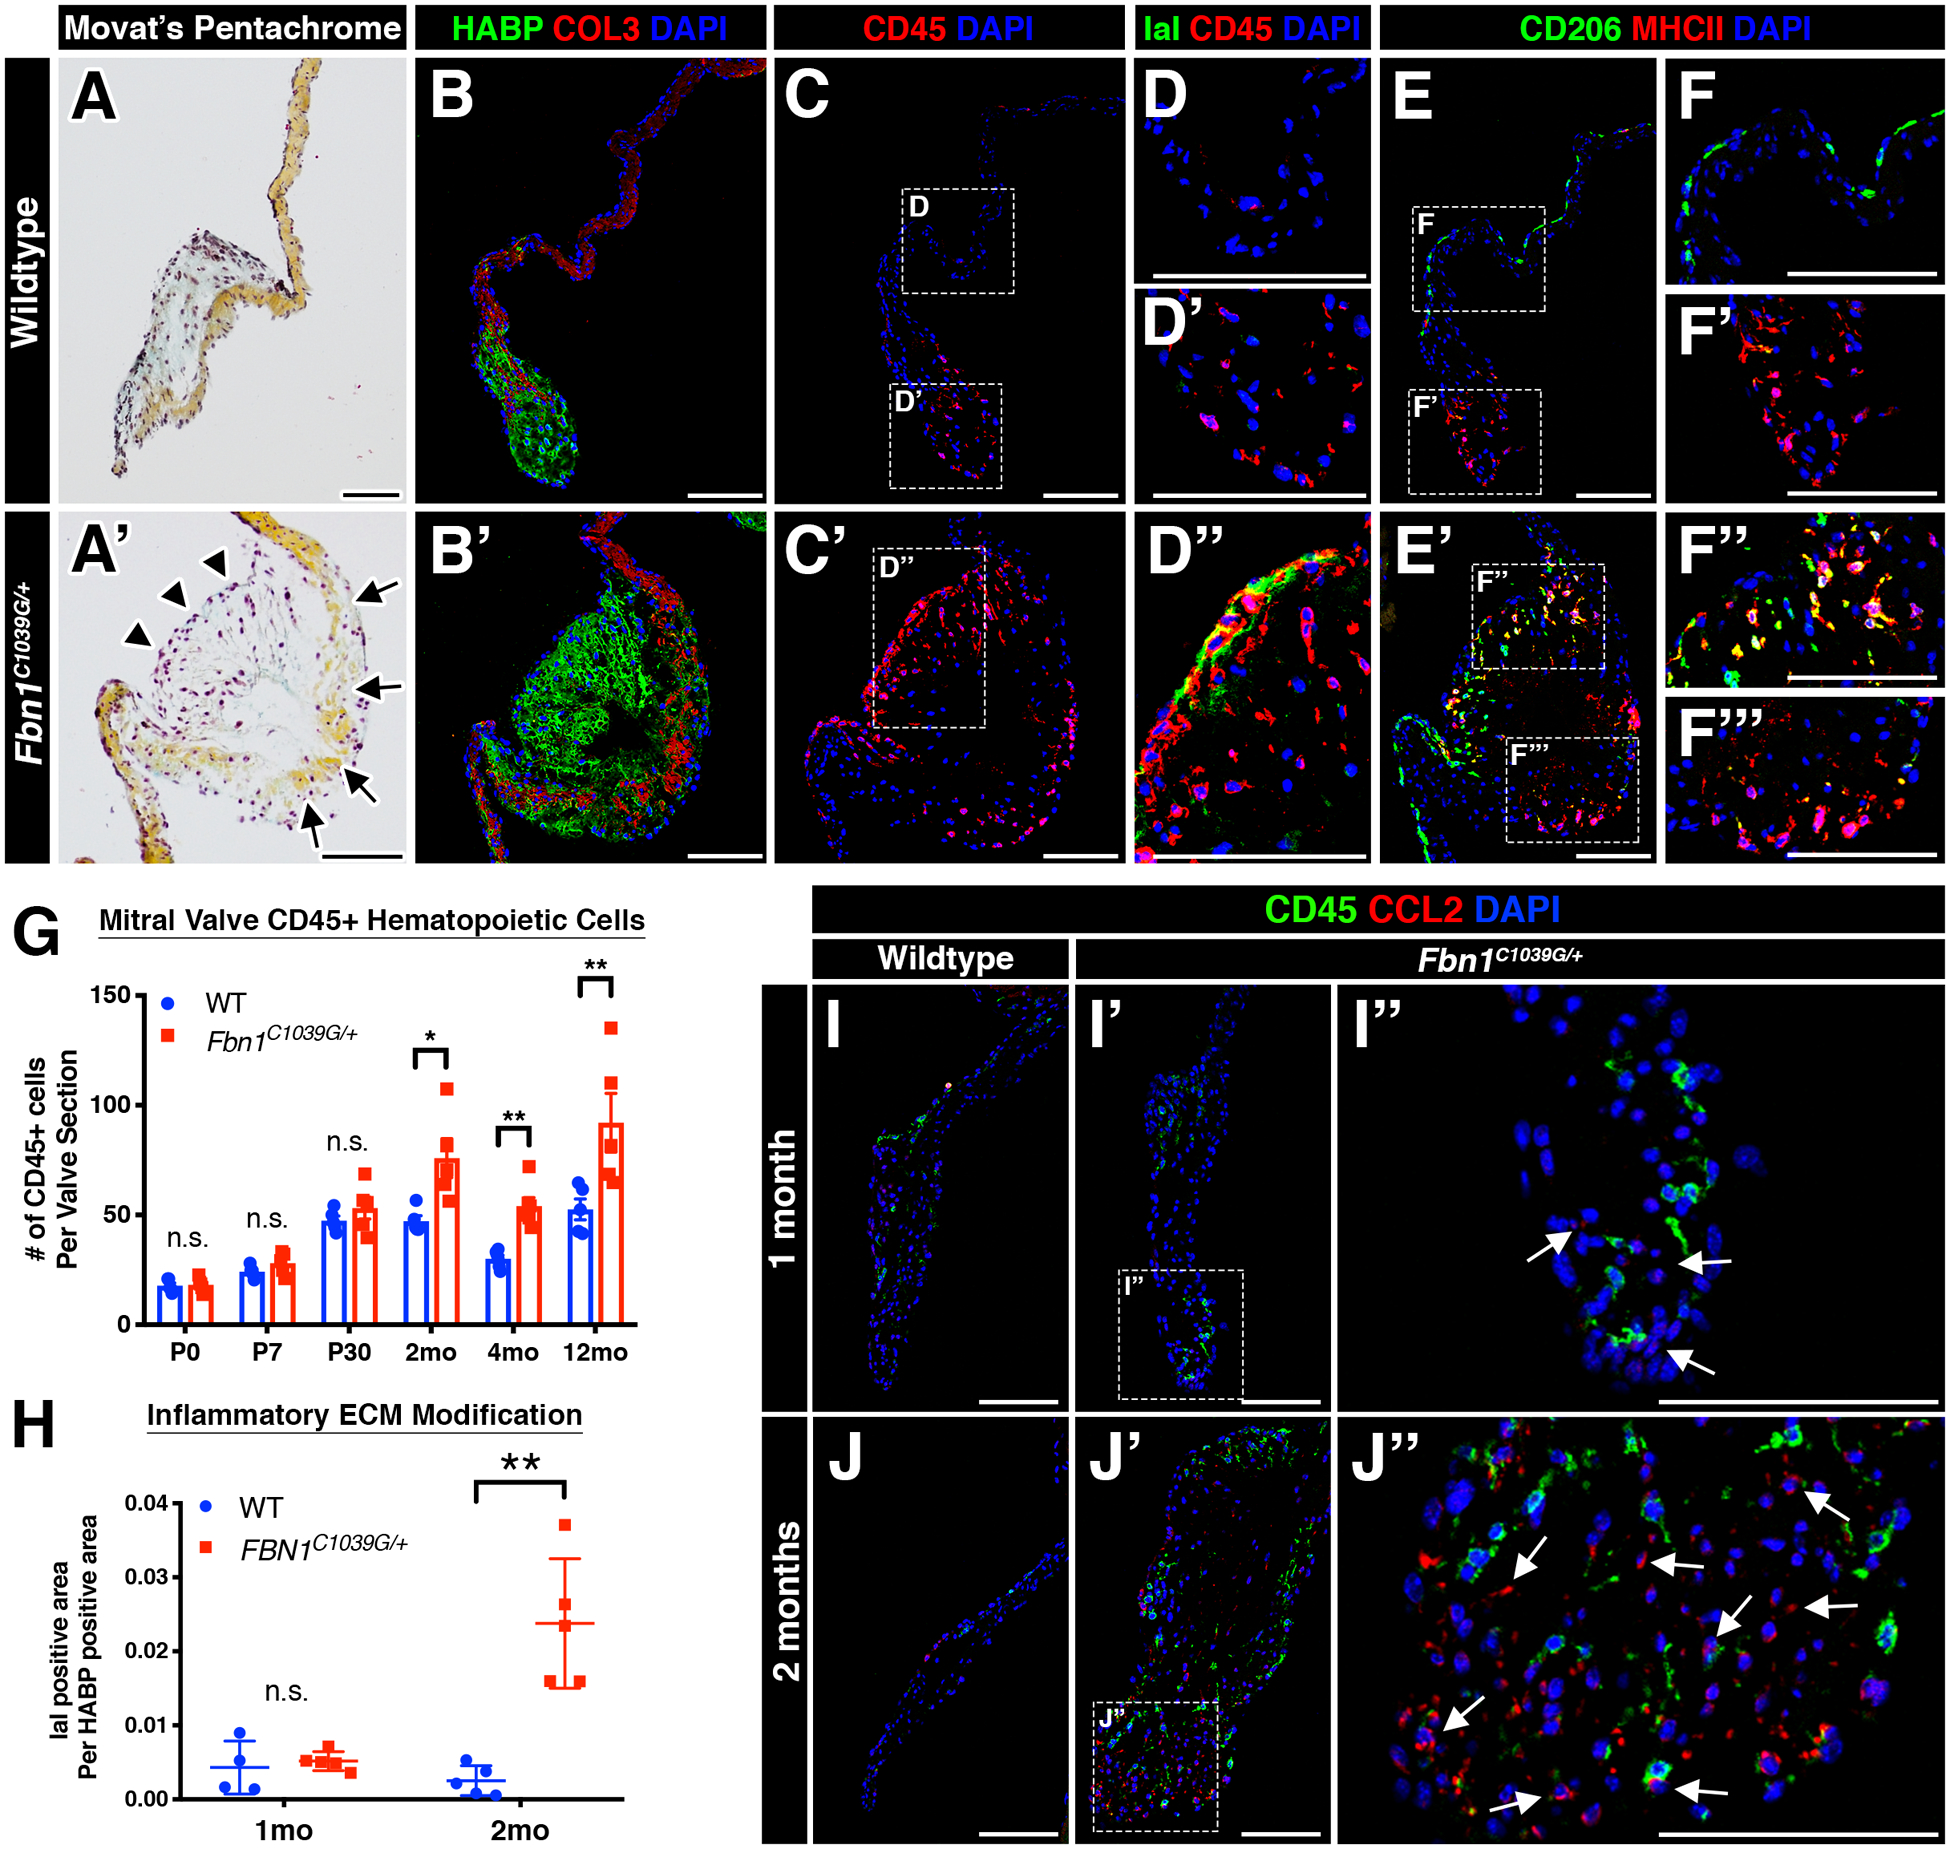
FIGURE 2: Myxomatous mitral valves in Marfan syndrome mice exhibit a pro-inflammatory micro-environment.

A-A’: Representative histologic images of the mitral valve at 2 months of age in wildtype (A) and Marfan syndrome (A’) mice using Movat’s pentachrome. Abnormal valvular ECM remodeling comprised of collagen fragmentation (arrows) and increased proteoglycan (arrowheads) is present in Marfan syndrome mice (A’) versus controls (A). The anterior leaflet is shown. B-B’: Increased proteoglycan deposition (green) and collagen fragmentation (red) can also be seen by confocal microscopy. Note the discontinuity of collagen (red) in mutant mitral valves (B’). C-C’: By confocal microscopy, CD45+ leukocytes are noticeably increased in MFS mitral valves (C’) versus controls (C) and are localized to regions of abnormal ECM remodeling. D-D”: MFS mitral valves exhibit immunogenic modification of the proteoglycan layer comprised of increased IaI deposition (green; D”) versus control mitral valves (D, D’). E-F’’’: CD45+ leukocytes are primarily comprised of two subsets of macrophages (CD206 and MHCII) that are spatially distinct in wildtype valves (E). Note that MHCII+ macrophages remain at the distal tips of the mitral valve (F’), whereas CD206+ macrophages run along the length of the valve leaflets (F’). In diseased valves, spatial preference of macrophages is lost, as MHCII+ and double-positive CD206+MCHII+ macrophages are located in the vicinity of CD206+ macrophages (F”, F’’’). G-H: Quantification of CD45+ leukocyte numbers (G) and IaI deposition (H). I-J”: Representative fluorescent images of CCL2 expression in WT and MFS mitral valves at one and two months of age. No significant differences in CCL2 expression was observed at one month of age (I-I”). However, CCL2 was significantly increased by two months of age in MFS mitral valves (J’-J”) versus control valves (J). CCL2 protein was predominantly expressed in CD45- populations and also deposited in the extracellular space (arrows, J”). Note that CD45+ cells are observed in the vicinity of CCL2. Data are represented as mean ± SEM. *p<0.05 and **p<0.01. n.s. = not significant. n=6–8 mice/genotype/timepoint. Scale Bar = 100μm. Abbreviations: HABP=Hyaluronan Binding Protein; COL=Collagen; IaI= Inter-alpha-trypsin inhibitor; mo=month.
