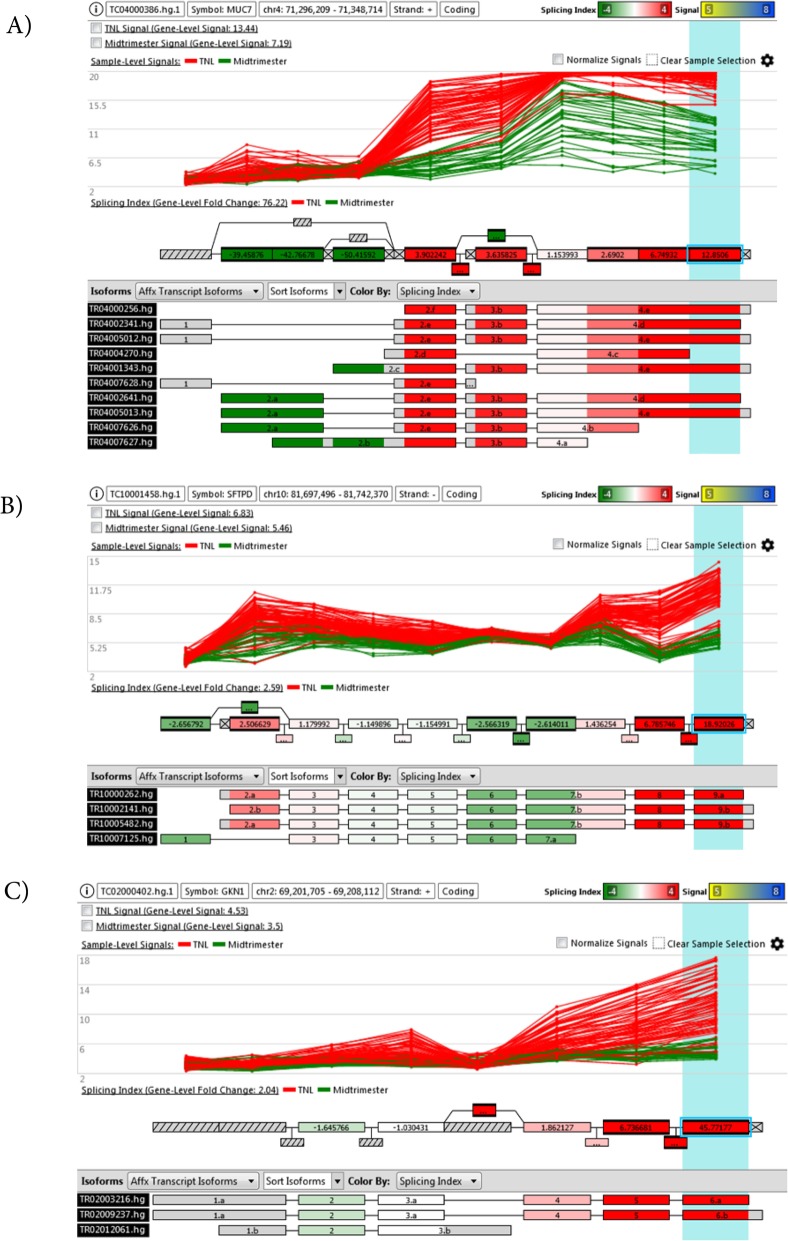
Fig. 5.
Example of differential expression and splicing associated with gestational age differences between midtrimester and term gestation groups. Each panel refers to a different gene (a: MUC7; b: SFTPD; c: GKN1). The top panel shows the normalized gene expression levels in each sample (line) and each probeset (dot) of a given patient. The middle panel shows a representation of the gene model with the color scale giving the splicing index for each probeset. The bottom layer shows possible transcript isoforms

