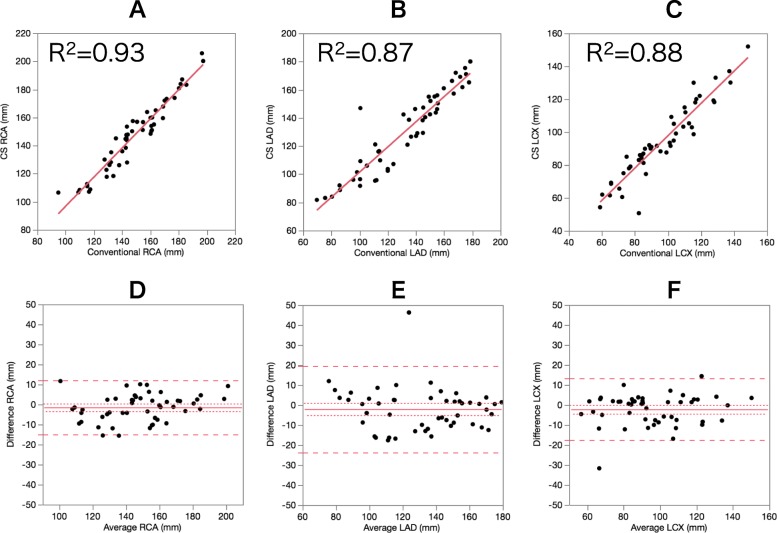
Fig. 6.
Scatter plots and Bland-Altman plots for the visible vessel length in the two techniques. In Bland-Altman plots, the solid line indicates the mean difference between the two techniques; the long-dashed lines indicate the corresponding double standard deviation intervals; and the short-dashed lines indicate the 95% confidence interval of the mean difference. a/d: right coronary artery, b/e: left anterior descending artery, c/f: left circumflex artery

