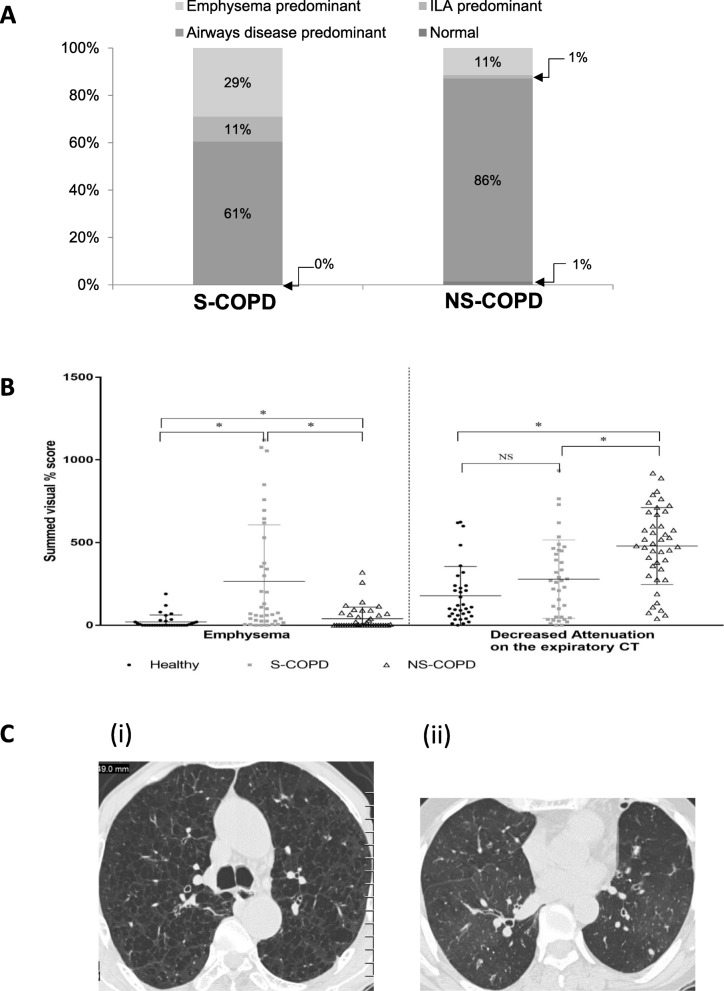
Fig. 2.
Differences between smoker COPD (S-COPD) (n = 38) and non-smoker COPD (NS-COPD) (n = 70) on inspiratory-expiratory high resolution computerized tomography (HRCT) imaging (a) Showing HRCT classification of smoker and non-smoker COPD, including airway disease (black bars), emphysema (open bars) and interstitial lung abnormality (ILA) predominance (grey bars); (b) dot plot for emphysema and decreased attenuation of expiratory CT in S-COPD (■) and NS=COPD (△) compared to healthy subjects (●), where bars indicate median and interquartile rages and * p < 0.05, (c) Representative HRCT images of Smoker-COPD showing extensive centrilobular emphysema in the upper lobes and non-smoker COPD showing generalized decreased attenuation and some bronchial wall thickening

